 Technology from Europe: Technology from Europe:
France/Belgium
Capabilities extended for integrated reservoir characterization
Stéphanie Gottlib-Zeh and Brian Moss, Techsia S.A., Montpellier, France
Over the past year, proprietary TECHLOG software from Techsia S.A. has been enlarged from a niche product providing sophisticated neural net solutions into a much broader system. It now answers two deficiencies in current integrated reservoir characterization practice.
First, there is often a lack of detailed workflow covering extensive use of data from different disciplines to condition key results. Second, this occurs because the tools available lack the capabilities that are necessary to carry out all the tasks. This software brings added value in terms of new tools and new ways of working. For example, users can examine simultaneously, and in linked interactive sessions, many different views and data interpretations. This new capability allows users to keep control over results at all times and not be forced to accept the statistical solution.
Integration requires full representation of one data set within another, usually at a different scale of measurement. Integration should involve detailed indexing of coarser-scaled measurement by the finer (and hence), more exact data type. Accordingly, the software provides a full workflow capability and many different viewers in an interactive environment. Users can perform their existing work scope more thoroughly and efficiently.
Workflow in this software extends from initial data acquisition through petrophysical analysis to elicitation of hydraulic units. These are quantified against geological facies defined by logs indexed against core data. Significant time savings in static model building are achieved. Once loaded, log and core data can undergo instant analysis and harmonization, drastically reducing data management overhead. Users can interrogate and understand complete data sets in their projects – contents, compatibility of curve names, units, depth ranges and well properties (locations, mud types, contractors, etc.).
Aberrant data can be identified rapidly and removed or flagged. Once data are documented and harmonized, wells may be grouped by spatial, cultural or environmental criteria. Log responses can be clustered and compared, and all wells rapidly investigated for data effectiveness, summarized as key parameters over the depth range of interest. Thus, a project's high-potential wells are immediately identified, and the user may concentrate his data interpretation tasks on these high-grade wells. These tools save scores of man-hours on projects comprising several hundred wells.
When bringing data together from different disciplines, precise models must exist to understand the data's range and limitations. The software brings specific core data models and analysis tools within the same ergonomic user interface as that used for log data manipulation. It becomes much easier to include core data into the main analysis. Petrophysical interpretation benefits from graphical parameter selection; multiple-choice algorithm specification (from simple equations to multiple log inversions); graphical sensitivity analysis; and associated uncertainty evaluation.
An extension of petrophysical tasks is to partition log responses on the basis of geological facies observed in core data. Here, the new tool of choice is the indexed, self-organizing map. This neural network technology is particularly effective at uncovering non-linear groupings within correlated data sets. These are then geologically interpreted by indexing against a facies description curve.
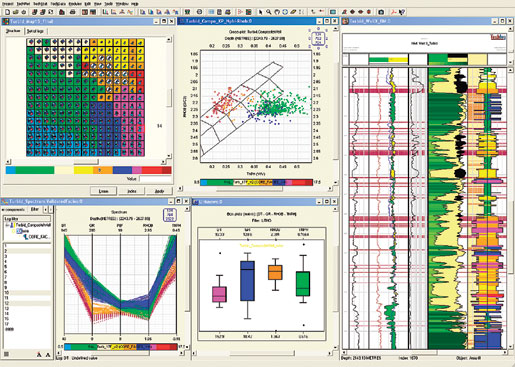
Commonly, raw core descriptive data are poorly represented in the log domain (the log responses of subtle, second-order effects of geological fabric variation, when observed in core are often ambiguous). However, iterative refinement, using all the software's tools – especially the log spectrum, multivariate display (see illustration) – provides crisp representations of core and log co-variability. This results in robust prediction of geological properties.
 |
|
Interaction (highlighted points and depths) among a number of TECHLOG viewers assists users in understanding their data variability. Image shows (from top left) a self-organized map indexed by facies, log cross-plot, LogPlot display, Log Boxplot, log spectrum analyzer.
|
|
Permeability and other formation properties are parameterized, using different neural network architecture. Together, they elicit petrophysical partitions or hydraulic units for quantitative comparison against the geological facies prediction. The result is a quantitative assessment of the chance of finding a particular hydraulic unit, given the presence of particular geologic facies. This provides direct, quantitative sampling distributions for input into 3D, geo-cellular reservoir models prior to simulation studies.
The software's complete petrophysical workflow facilitates tight integration of core qualitative and quantitative information into the log domain. This greatly extends key data utility. Petrophysical interpretations are used to elicit hydraulic units, wherein formation storage and transmissibility properties are expected to be similar. Combining the petrophysical view with the geological predictive view enables, for the first time, direct integration of petrophysics with geology in a quantitative input to 3D, flow simulation models. Already, some 20 oil and gas companies, including three majors, have benefited from Technia's consultancy or from direct, internal use of the firm's various software packages. 
|

