50th Annual ReedHycalog Rig Census
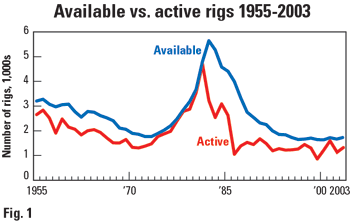
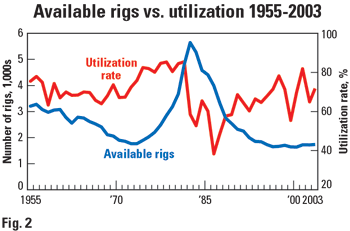
Drilling Report50th annual ReedHycalog rig censusU.S. rig fleet remains strong, buoyed by higher commodity pricesGregory B. Petterson and Tory A. Stokes, ReedHycalog, Houston The ReedHycalog rig census has been an industry standard for half a century. When Grant Prideco acquired ReedHycalog last December, it was felt that the industry valued having an annual barometer of the drilling fleet, so the census was reactivated. Because the census was not taken in 2002, an estimate of activity was developed using information supplied by Rig Data. The US rig fleet remains strong, losing just three units since the census was taken two years ago. Drilling activity has fluctuated greatly since 2001’s activity peak. However, fleet utilization still measures a solid 78% according to this year’s data, Figs. 1 and 2.
STATISTICAL HIGHLIGHTS Since data from 2002 were not collected, all statistical comparisons contrast 2003 with 2001. Key statistics from this year’s census include the following:
RIG DELETIONS – ATTRITION AFFECTS AGING FLEET Some carryover of 2002’s economic decline remains, even though strong commodity prices have prompted a recent recovery. Despite improved market conditions in 2003, attrition continues to affect an aging fleet. Rigs deleted from the US fleet totaled 172 over the two-year period. This is a significant increase compared to 96 rigs deleted in the 2001 census. Reductions were reported in five categories, Table 1:
Rigs auctioned for parts, or cannibalized to support other units, numbered 59 in 2003. This was the largest category of deletions, and more than double the number of rigs that were scrapped in 2001. However, many of the rigs cannibalized in prior years are being used to build new units that are coming back into the fleet as rigs assembled from components. Census rules exclude from the available count rigs that require significant capital expenditures to be operable. Rig owners said that 57 units would need capital improvements to go back into service. This is significantly higher than the 36 units removed for this reason in 2001. Rig owners were also asked whether they planned capital improvements for their rigs over the next 12 months. They reported that just 8% of available units are scheduled for refurbishment or upgrades. Rigs typically move into and out of the US, and these units are tracked each year. The number of rigs leaving the country this year, 45 units, was exceptionally high – primarily offshore rigs moving out of US waters. Rigs moving out of the US have not been this numerous in more than a decade. A more typical year for rig departures was 2001, when six rigs exited. Rig movement into the US is covered below. The number of rigs deleted from the census because they were stacked for more than three years was just seven in this two-year period, versus 28 in 2001. This is a considerable decline, possibly attributable to the fact that most rigs are not stacked “ready” for a long time in this economy. Many idle rigs are sold, cannibalized or deleted from the census, due to capital expenditure requirements, before their aging status removes them from the available fleet. Rigs that were destroyed during the past year comprise another deletions category. Owners reported in this year’s census that four units sustained irreparable damage. ADDITIONS – RIG BUILDING OFFSETS ATTRITION Recent commodity price hikes have spurred the drilling sector to continue building additional rigs to take advantage of increased profitability potential. The US fleet gained 169 rigs in 2003, almost as many as the 182 additions two years ago. Ironically, 2001’s figure had not been enough to offset reductions to the fleet and provide an overall increase. Fleet additions fall into one of four categories, Table 1:
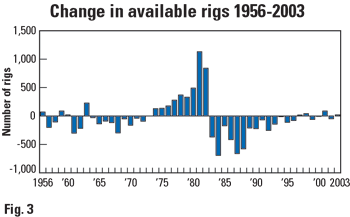
Units assembled from components numbered 74, down from 105 in 2001. This indicates that not all rigs deleted from the fleet had been completely depleted by cannibalization. As market conditions have warranted, owners remain able to assemble rigs fairly quickly, despite the fleet’s age. A surge of newly manufactured rigs has entered the market this year, with 48 units added. This year’s number is significant, given that the average number of newly manufactured rigs entering the census per year has been 3.4 since 1988. Owners reported building 44 new land rigs and four offshore units. The number of rigs brought back into service numbered 37 this year, versus 56 in 2001. After being counted in the census in previous years, each of these rigs was subsequently removed for inactivity or inoperability. As drilling conditions improve, owners find it profitable to reactivate some of these older units and put them back into service. Ten rigs were brought into the US from other countries during the 2003 census, compared with 12 in 2001. Eight of the imported units were land rigs, and two were offshore units. Considering that 45 rigs moved out of the US this year, a net decline of 35 units resulted from rig moves. Total rig additions numbered 169, while deletions totaled 172. Therefore, the rig fleet’s net change over the past two years was a three-unit decrease, showing overall fleet stability despite changes on a rig-by-rig basis. (Estimates for changes in the fleet were made for 2002 and are reflected in Fig. 3.)
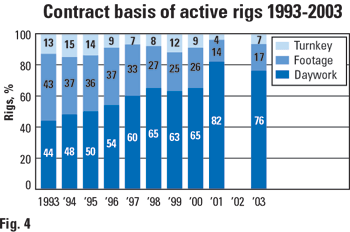
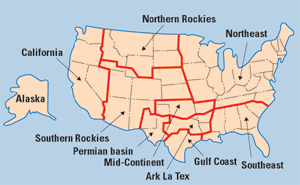
ACTIVITY STILL RELATIVELY STRONG The drilling industry is very reactive to commodity prices. Fueled by sharply higher gas prices, a sizable jump in drilling was experienced two years ago. Activity then followed commodity prices down in 2002. The activity recovery seen in 2003 is slower than would be predicted, given the robust gas and oil pricing. Census statistics for 2003 show an active count of 1,334 rigs. This is down from 2001’s peak of 1,593, but it is approaching a healthy utilization rate. The methodology used to count active rigs for the ReedHycalog census is different from other active, weekly rig counts that record units drilling during a single day. The census counts a rig as active if it has “turned to the right” any time during a defined 45-day period (this year’s period was between May 10 and June 23). Therefore, the ReedHycalog statistic always will be higher than other reported counts, because a longer time period is used to monitor rig activity. Almost every census region reported fewer rigs working than two years ago, Table 2. Regional declines were as follows: Southeast states (-76 rigs), Gulf Coast (-52), Permian basin (-38), Mid-Continent (-36), Northeast states (-23), California (-16), ArkLaTex (-13), Southern Rockies (-5), and Alaska (-2). The only census region reporting a gain was the Northern Rockies, with its active count increasing one rig from 2001’s census. The 385 available rigs that were not drilling during the census period were classified according to the length of time they had been idle. Rigs stacked less than one year numbered 157; one to two years, 213; and two to three years, 15. Aging rules of the census state that any rig stacked for longer than three years will be removed from the available fleet. Adding the 157 rigs stacked less than one year to the 1,334 active units provides the total number of rigs that drilled sometime during the past year. The full-year utilization figure indicates that 1,491 out of 1,719 available rigs (or 87%) were put to work by rig owners over the past year, as compared to 97% in the 2001 census. In addition, contractors tell us that 52% of their stacked rigs have a greater than 50% chance of going back to work in the next 12 months. They are also bidding jobs with all but 6% of the available fleet. Types of contracts covering the active rig fleet provide evidence of a market that remains advantageous to drilling contractors. This year, day work terms comprised 76% of all contracts on the most recent well drilled by each rig. In 2001, day work made up 82% of all contracts. Footage contracts are now 17%, and turnkey contracts make up about 7%, Fig. 4.
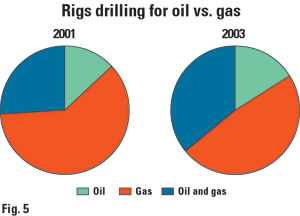
Other information gathered on the last well drilled by each active rig includes the following:
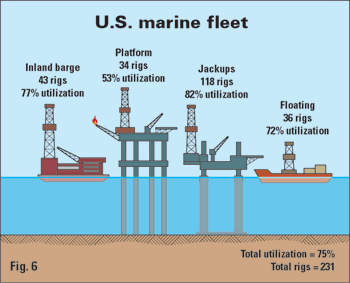
UTILIZATION RETURNS TO NORMAL As one indicator of industry health, rig utilization (the ratio of active to available rigs) measures the supply-and-demand balance. Two years ago, the industry saw a spike in the utilization rate, bringing it up to 93%, a level not seen since the early 1980s. This year’s 78% utilization rate returns the supply/demand ratio to a level much closer to the historical average of 74%. Every US region cited utilization decreases for 2003 vs. 2001. The Gulf Coast showed the largest drop, down 23 percentage points to 75% over the two-year span. Utilization figures for other regions were as follows: Mid-Continent, 79% (-19 points); Permian basin, 80% (-17); Southeast states, 77% (-17); ArkLaTex, 78% (-14); Northeast states, 72% (-13); California, 64% (-7); Alaska, 42% (-6); Northern Rockies, 76% (-5); and Southern Rockies, 91% (-3). Examining land and offshore rigs separately, gross utilization for land rigs slid to 78% from 93% in 2001, Table 3. The offshore utilization ratio continues to fall behind the land rig ratio. This year’s marine fleet utilization was 75%, down 15 percentage points from two years ago, Fig. 6.
Bottom-supported jackups were in greatest demand, according to census results. These rigs had 82% utilization. Units showing the lowest utilization remain platform rigs, down to 53%. It is also worth mentioning that rigs in almost every depth capacity showed utilization decreases in 2003. However, the most shallow rigs counted by the census – those rated to drill from 3,000 to 5,999 ft – actually showed a single percentage point increase to 84%, Table 4. As previously stated, overall gross utilization measured 78% during the 2003 census period. This rate does not necessarily mean that rigs were working 78% of the time, because a rig drilling just one day during the 45-day census period would still be counted as utilized. However, rig owners were asked to estimate the number of days during the 45-day period that their rigs were actually on jobs (moving days not counted). The average number of days each unit was utilized this year was 40, down two days from 2001. Applying this factor to the 78% gross utilization rate gives an “on-the-job” utilization of 69%. This produces an even greater spread in these two statistics than was the case in 2001. At that time, gross utilization measured 93%, and the “on-the-job” ratio was up to 87%.
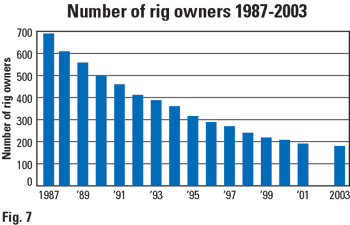
INDUSTRY CONSOLIDATION Although consolidation continues to describe the industry in 2003, the rate may be slowing a bit. For more than 15 years, the number of rig owners has declined, as mergers and acquisitions have become an economic necessity. The number of rig owners dropped by just 12 over the last two years, versus a one-year drop of 17 in 2001. This year, rig owners number 179, Fig. 7. The 2003 census also tracked specific rigs that were part of companies involved in mergers or acquisitions. According to rig owners, about 3% of the available fleet, or 45 units, changed hands. This is a dramatic drop from 340 units, or 20% of the fleet, that were affected two years ago. These units do not include rigs that were sold while needing large capital expenditures to go to work, or were subsequently scrapped for parts.
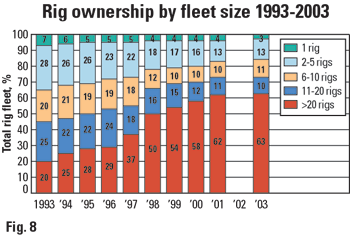
Industry contraction generally puts more units in the hands of larger fleet owners. Companies that own 20 or more rigs now hold 63% of the total fleet, up one percentage point, Fig. 8. A decade ago, these larger companies owned just 20%. The average rig owner now holds 10 rigs, up from nine in 2001. Drilling contractors primarily own most rigs, or 96% of all units, the same percentage as last year.
CONTRACTORS OPTIMISTIC ABOUT STABILITY A survey of US contractors taken in conjunction with the rig census reveals additional insight. Contractors were asked to estimate various changes to their business, with some comparing 2003 to 2002. Sixty contractors chose to participate in this year’s survey, representing about 34% of all contractors, and they own about 72% of the total rig fleet. Surveys were received from companies operating rigs in every US region, representing both large and small firms. For the 13 years that this survey has been conducted, respondents have been asked to rank a set of issues by importance to their business. The top concern of contractors this year was “rig rates,” as it has been many times in the past. Since higher rig rates improve a contractor’s operating margin, it is not surprising that this continues to be a top contractor concern. “Crew availability” was the second highest concern. The industry’s instability has created a shortage of qualified labor, whose absence is magnified when commodity prices go up and contractors need to put additional rigs back to work. “Insurance costs” were the third greatest concern, although they had not been in the top three issues during the previous decade. Insurance costs have increased in recent years, and they now appear to be affecting drilling economics significantly. Eighty-four percent of contractors surveyed reported that their rig activity was up when compared with 2002, with an average increase of 28%. Almost all firms cited higher commodity prices as the reason for this large gain. Most contractors believe that prices will remain at these levels. Many are optimistic that drilling will increase further in the near future. According to survey data, onshore rates have averaged $8,484/day during the May – June 2003 period. In addition, land contractors were asked to estimate the change in land rig day rates since last year. Estimates revealed an average increase of about 6% since 2002. Offshore rates averaged $39,429/day, and these contractors tell us that their rates have gone down about 8% since this time last year. However, offshore data are not statistically significant, due to sample size. Most contractors reported elevated maintenance and labor expenses. Eighty-three percent plan to spend more on rig maintenance than they did last year. On average, they expect maintenance costs to rise about 17%. This seems to climb annually, as other costs rise and the rig fleet continues to age. Many contractors cited increased crew labor rates as well, averaging 4% higher. Contractors were also asked specifically if they planned to spend more on tubular goods in 2003. The average contractor thought that he would spend 5% more on tubular goods this year. In recent years, rig owners have had more good years than bad, although most would claim there is still room for improvement. When contractors were asked at what level oil and gas prices need to be to have a positive effect on their business, their average estimate was $29.70/bbl for oil and $6.30/Mcf for gas. However, land rig contractors say that land rig rates would need to rise 65% before rates would support purchases of newly manufactured rigs. Most rig owners believe the industry has stabilized somewhat, and they are optimistic as long as product prices are sustained. When questioned about their plans for the next five years, contractors generally expected little change, with 45% of companies planning to remain as they are, Table 5. A smaller share, 33%, plans to expand fleets over the next five years. Thirteen percent will pursue international opportunities in the future. Eight percent are seeking merger opportunities, and 7% are diversifying into other businesses. Just one contractor claimed that his company would downsize its fleet during the next five years.
IMPROVED UTILIZATION PREDICTED For US drillers, 2003 has been a year of recovery, and most industry experts foresee no downturn in the near future. ReedHycalog predicts the available rig count will remain essentially unchanged, as contractors have not indicated a need to build a great number of rigs over the next year. Furthermore, small activity increases could be met by rigs that are stacked. Survey respondents indicated “slow and steady growth, if commodity prices remain.” Based on this outlook, a 5% activity gain was used to estimate future utilization. This indicates that the utilization rate will improve slightly, to 80% or more, which would be considered a return to a healthy utilization rate. ReedHycalog looks forward to a strengthening industry, and a healthy drilling community. Tables of historical census data from 1955 – Present are available in the “Press Release” section at www.grantprideco.com
|
|||||||||||||||||||||||||||||||||||||||||||||||||||||||||||||||||||||||||||||||||||||||||||||||||||||||||||||||||||||||||||||||||||||||||||||||||||||||||||||||||||||||||||||||||||||||||||||||||||||||||||||||||||||||||||||||||||||||
- Coiled tubing drilling’s role in the energy transition (March 2024)
- Using data to create new completion efficiencies (February 2024)
- Digital tool kit enhances real-time decision-making to improve drilling efficiency and performance (February 2024)
- E&P outside the U.S. maintains a disciplined pace (February 2024)
- Prices and governmental policies combine to stymie Canadian upstream growth (February 2024)
- U.S. operators reduce activity as crude prices plunge (February 2024)

