Production Report
Fiber optic temperature monitoring optimizes water injection, well production
Recent experience in Oman shows that a fiber optic-based, distributed temperature sensing system can be a reliable means of monitoring a well’s performance through its life, allowing an operator to optimize well placements and production
Mohammad Al-Asimi, Occidental of Oman, Inc., Muscat, Sultanate of Oman, and George Brown and Charlie Cosad, Schlumberger
The oil and gas industry continues to trend more and more toward a real-time business, and defining what that term means. The increasing complexity of completions and availability of measurements, in the drive to optimally drain reservoirs, means that operators are forced to become proactive in their quest for information. This applies to both fine-tuning the well and making more informed, large-scale recovery decisions.
Fiber optic measurement technology, used in gathering various downhole data, is becoming more accepted by the industry with every installation. When combined with other permanent downhole sensors, the information results in current knowledge of the well’s performance throughout its life, as well as using the data to optimize future well designs. Such information, in addition to optimizing production, can reduce or eliminate expensive intervention procedures.
Sensa, a Schlumberger company, provides fiber optic monitoring capability for distributed temperature. These data are collected at surface and transmitted to a remote database, available for viewing/ download over the Internet with security provided by the firm’s InterACT system. The data transmission method is flexible – e.g., satellite or cable – and often uses existing field IT infrastructure.
DTS measurement technology can result in better decisions regarding water and gas breakthrough; zonal isolation; steam management; injection monitoring; artificial lift performance and well integrity. DTS complements other well diagnostic activities carried out during the production phase, and can result in better-planned, “value for money” well interventions. These may include well tests, production logs, water shutoffs and stimulation treatments.
Sensa has installed its fiber optic sensing systems in more than 300 wells worldwide, the majority of which have been for steam floods.
MEASURING TEMPERATURE
Distributed temperature is measured by sending a pulse of laser light down the fiber, Fig. 1. Molecular vibration, which is related directly to temperature, creates weak, reflected signals. These signals are detected at the surface display and converted to temperature values at 1-m intervals. The temperature data can be displayed on-site, stored for later analysis or transmitted to remote locations. Measurements can be made continuously without intervention, production loss or risk to the well.
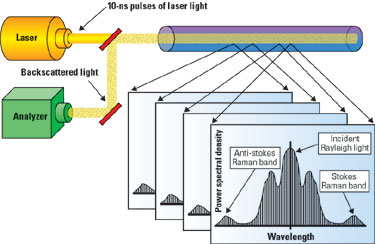 |
Fig. 1. A DTS system sends a pulse of laser light down the fiber. Resultant molecular vibration, which relates directly to temperature, creates weak, reflected signals. These signals are detected at the surface display and converted to temperature readings at 1-m intervals.
|
|
The data can be correlated with information acquired at the surface, including flowrates and water cut, as well as from openhole logs and formation test data. This correlation results in qualitative and quantitative information about changes occurring downhole.
Temperature distribution downhole is a function of the mass rate of the flowing fluid; formation and fluid thermal properties; the geothermal gradient and time. If the system’s thermal properties can be determined or estimated, and the geothermal gradient is known, then flowrate can be determined from temperature profiles.
FIBER INSTALLATION
Installing the subsurface portion of the DTS is fairly straightforward. A 1/4-in., diameter, control line is designed into the completion, commonly attached to the production tubing. The fiber is then pumped into the control line, using a patented hydraulic deployment system.
There are two installation techniques, utilizing single or double-ended fibers, Fig. 2. Single-ended measurement installations are performed by landing the completion string, and then pumping the fiber down a single control line.
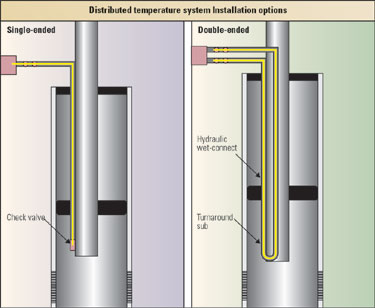 |
Fig. 2. Installing the subsurface portion of the DTS can be accomplished by using one of two techniques, utilizing single or double-ended fibers.
|
|
In a double-ended installation, the fiber is pumped hydraulically down a 1/4-in. control line, around a U-tube and back to the surface. The laser sends a light pulse down one side, and then it switches to send another light pulse down the other side. This method provides greater accuracy and resolution, which is especially important in applications requiring analysis of small temperature changes.
CASE STUDY – WATER INJECTORS
Occidental of Oman (Oxy) wanted to optimize completion procedures and improve its knowledge of Safah field’s Shuaiba reservoir and its performance. The company installed fiber optic DTS systems in two horizontal water injector and three horizontal oil producers during 2002, to monitor long, openhole reservoir intervals during well startup, production and injection operations.
The Safah A well was drilled and completed with a long, openhole horizontal section across the reservoir. However, the well experienced gas breakthrough during this phase, due to its proximity to a gas injection well approximately 500 ft away, resulting in diminished oil production.
The DTS fiber was installed during a workover operation. The DTS was able to identify the exact locations where gas breakthrough was occurring. This was possible, because the thermal effects of breakthrough take time to dissipate and were still present after the workover.
The well underwent 39 hr of water injection and was shut in for 24 hr. The DTS identified a single, 1,000-ft interval taking cooler injection water, the same interval that had experienced gas breakthrough during the initial production phase. This interval displayed the highest injectivity, although it represented only a small percentage of the intended injection zone needed to achieve optimal flooding.
Water injection was resumed for a further 81 days, and then the well was shut in again and allowed to warm up for 24 hr. DTS data showed that the injection interval had expanded toward the toe and was more than 3,000 ft long. However, the bottom half of the Shuaiba reservoir was still not flooded.
Six months later, a third shut-in took place and showed that the reservoir had then flooded most of the way along the horizontal section. This information provided Oxy with a greater understanding of the Safah water injection program. As a result, the operator was able to optimize its injection design, procedures and surveillance by knowing which reservoir portions were initially swept.
CASE STUDY – OIL PRODUCERS
The DTS system was installed in July 2002 in Safah C, a newly drilled, horizontal well. DTS temperature data were acquired along the reservoir interval before the well was put on production and again in July, August and October as the well was being produced. This well, by October, had dropped to 50% relative to initial production, and the GOR increased about three-fold.
Comparing the June data (before the well was put on production) to a geothermal gradient calculated from the well trajectory, shows that cooling had taken place during the drilling process, mainly towards the heel. Thus, the well had not quite warmed back to the expected geothermal gradient at the time the data were acquired. However, by August, the well’s thermal response showed a significant decrease below the expected geothermal gradient, down to about 9,000 ft with little change below this level. By October 2002, the interval between 9,000 and 11,000 ft was also exhibiting significant cooling. By these times, any drilling-induced cooling should have dissipated completely.
The reason for this response is the Joule Thomson effect. As oil with a high gas content flows toward the well, the near-wellbore pressure drop causes cooling. This can be observed as a temperature drop in the wellbore, itself. Consequently, the well was only producing down to 9,000 ft in August, and by October 2002 it had cleaned up down to 11,000 ft.
Using PIPESIM 2000 software, the reservoir can be simulated as a sequence of horizontal flow elements. Each element’s permeability controls the reservoir’s Joule Thomson cooling. A nodal analysis is performed to calculate the wellbore temperatures that correspond to the flowrate and wellhead pressures that are being simulated. The individual reservoir elements’ permeabilities are varied until the calculated temperatures match the DTS-measured data. Once this is achieved, the permeability distribution along the wellbore reflects the actual permeability distribution, resulting from the reservoir and skin permeability, and the model output’s flowrate along the horizontal section.
The analysis confirmed that less than 100 bopd was flowing from below 9,000 ft in August. This had increased to over 200 bopd by October, even though the well’s total production had dropped. This was taken as evidence that the well was cleaning up over time, so Occidental modified its well stimulation procedures on subsequent wells, to improve the clean-up rate.
CASE STUDY – GAS LIFT MONITORING
During the start-up of the Safah D, as gas was being injected down the well to bring it on production, the well was being monitored by the DTS temperature monitoring system. Injected gas, blowing through gas lift valves, causes Joule Thompson cooling at the valve depth. This can be identified by its temperature response.
DTS data showed that a retrievable gas lift valve at a measured depth of 3,600 ft was struck open, and gas was not lifting the fluid column. The valve was retrieved and replaced, however, the replacement valve experienced a packing failure resulting in continued circulation of gas.
This valve problem was also immediately identified by the DTS temperature response. A dummy valve was installed that prevented gas entry at 3,500 ft, enabling oil production.
The continuous use of DTS monitoring during Safah D’s gas lift startup immediately identified the problematic gas lift valves, resulting in their timely replacement and allowing production to begin sooner. Traditional diagnosis and intervention methods would have resulted in significant lost production. DTS data from the well also showed that the entire horizontal section contributed to production. This demonstrated that the improved stimulation procedure implemented by Oxy as a result of the Safah C data had been successful.
CONCLUSION
The results showed that it is possible to monitor long horizontal openhole intervals continuously during injection, cleanup and production, eliminating the need for multiple well interventions. The technique proved safe and cost-effective, with one-time installation costs comparable to a coiled tubing-deployed production log. 
THE AUTHORS
|
| |
Mohammed R. Al-Asimi joined Occidental Oman in February 2002 as a senior reservoir engineer in charge of waterflood monitoring plans. Previously, he served 10 years at Petroleum Development Oman. During that tenure, he worked as a wellsite petroleum engineer for two years, plus five years as reservoir engineer for the Qarn Alam asset team. Also he spent one year as a production supervisor for the Nimr field asset team. Mr. Asimi graduated in 1991 with a BSc degree in electrical engineering from the University of Portland. He earned an MEng in petroleum engineering from the University of Heriot-Watt, UK, in 1993.
|
|
George Brown joined Schlumberger’s Sensa unit in March 1999 as manager of Interpretation Development. He is responsible for developing interpretation methodology and the analysis of Sensa’s permanently installed, fiber optic measurements. He invented the Gas Cooling Element system used to enhance the fiber optic thermal response for low flowrate measurement in horizontal wells. Mr. Brown spent 15 years with BP Exploration in several posts, including head of Petrophysics at the Sunbury Research Centre. He was also senior formation evaluation consultant, working with the "Intelligent Wells" team that developed new permanent monitoring systems for horizontal and subsea wells. Before BP, he spent 12 years with Schlumberger Wireline, in the Middle East (Saudi Arabia, Dubai and Turkey) and North Sea (Aberdeen and Norway) regions, in a variety of operational and management positions. He holds a first class honors degree in mechanical engineering.
|
| |
Charlie Cosad works in Schlumberger's Well Completions and Productivity business segment, responsible for the strategy and coordination of activities around "production in real time" for that business. He joined Schlumberger in 1978 as a wireline field engineer in the Far East and then held a number of technical and managerial positions throughout the region. Later, he managed the Wireline & Testing businesses in different Middle Eastern countries before moving into the North Sea as a project manager in the integrated project management group. Mr. Cosad holds a BS degree in mechanical engineering from Syracuse University and an MS degree in aerospace and mechanical engineering from Princeton University.
|
|

