Global Resources
How recent trends are affecting global energy resources
Population and consumption growth in the Asia/Pacific region and Central and South America hold the future for the energy market
Dr. Rakesh K. Bhargava, Universal Ensco, Inc., Houston
Crude oil and natural gas are two of the world’s major, depletable energy resources. An analysis of these resources, combined with total primary energy consumption, national gross domestic product, population growth and associated CO2 emissions during the last decade, reveals that the oil and gas business and related industries are expected to grow in coming years. Growth rates will be comparatively higher in the Asia/Pacific region and Central and South America, provided the observed industrial and economic growth of the last decade continue.
BACKGROUND
Historically, a country’s energy consumption correlates with its standard of living and degree of industrialization. Fuel sources have evolved, driven by economics, technical advancements, politics and the degree of awareness of environmental impact. A good example is the variation of primary energy consumption (PEC) by fuel source in the US during the last 150 years.1 (Note, PEC is defined as total gross energy supply before conversion of the primary energy into its final form has taken place.) In the mid-19th century, 90% of fuel energy came from wood combustion. In the early 20th century, coal became the major source (77%), Fig. 1.
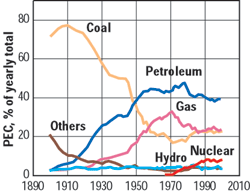 |
FIG. 1. Energy consumption of United States by fuel source during the last century.
|
|
By 1960, about 72% of energy consumed came from petroleum and natural gas combined, and coal’s dominance was reduced to 22%. By the end of the 20th century, combined petroleum and natural gas energy consumption declined to 62%, while coal provided 23%. Hydro, nuclear and others accounted for the rest. Others include energy sources such as geothermal, solar, wind and wood.
The knowledge of historical use of energy resources, in combination with population growth, among other factors, is helpful in understanding our future energy requirements. Other relevant parameters include reserves of fuel sources and gross domestic product (GDP, an economic growth indicator). It is estimated that about 80% of all the CO2 emissions result from combustion of fossil fuels, with a possible subsequent impact on global climate change.2 More than 85% (yearly average) of the world’s energy consumption during the last decade was produced from fossil fuels. Thus it is necessary to discuss CO2 emissions produced by these fuels.
The objective of this analysis is to identify world regions where oil and gas markets will become more active. The values of crude oil and natural gas reserves,3 production and consumption of crude oil and natural gas, PEC, population, GDP and CO2 emissions have been obtained from various sources.4 Note that emphasis is given to the changes rather than the absolute values of various parameters examined.
WORLD OIL AND GAS RESERVES
Compared to natural gas reserves, world crude reserves have not only grown slowly during the last three decades, but also have seen sudden increases in the late 1980s, primarily in Central and South America and the Middle East. At the end of 2001, world gas and oil reserves were 5,451 Tcf and 1,032 billion bbl, respectively. Compared to 1970, gas and crude reserves increased by about 244% and 69%, respectively, by the end of 2001, Fig. 2.
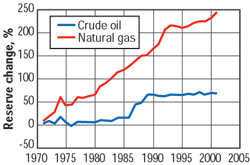 |
FIG. 2. Change in world total natural gas and crude oil reserves (reference year 1970).
|
|
A further examination of world gas reserves (NG_R) by region revealed that the maximum increase, compared to 1970, took place in the Asia/Pacific region. The smallest gas reserves increase occurred in North America, but a decreasing trend, particularly since the mid-1980s, has been observed. This trend is alarming, since the second highest gas consumption (30% yearly average of the world) took place in North America during the last decade. A look at changes in world gas reserves by decade shows that performance has been poorest in North America, with the worst trend occurring in the 1990s, Fig. 3.
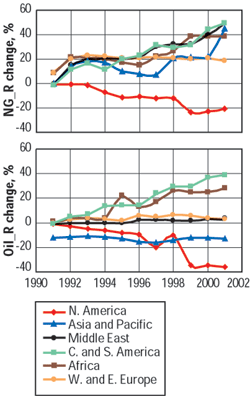 |
FIG. 3. Natural gas reserve changes (top) and crude oil reserve changes (bottom) are shown by region (reference year 1990).
|
|
The maximum oil reserve (Oil_R) decrease during the last decade was in North America, Fig. 3. The recent decline trend in North American oil reserves is also of concern, since North America was the largest oil consumer (30% yearly average of world total) during the last decade.
The most recent data (year ending 2001) on world reserves show that most (about 67% of world total) are in the Middle East. However, the largest gas reserves (some 39% of world total) are in the West and East Europe combined and, particularly, in the Former Soviet Union (FSU).
The reserve-to-production (R/P) ratio provides number of years for which a particular fuel reserve would last (assuming no new reserves are found). The R/P for oil, based on data for year 2000, for the major oil producing countries of the world, clearly identifies countries with fast depleting reserves, Fig. 4. Based on latest available production rates, reserves for the top three oil producers of the world--Saudi Arabia, Russia and the US – are expected to deplete in about 89, 21, and 10 years, respectively. The values of oil production (Oil_P) data, expressed as a percent of world total, are also included in Fig. 4.
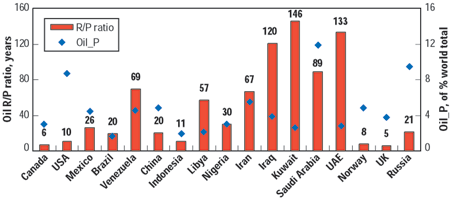 |
FIG. 4. Reserve-to-production ratio for crude oil for selected countries for the year 2000.
|
|
In the US, one of the world’s largest consumers and producers of gas, gas reserves are expected to last for around nine years (assuming no new reserve additions), Fig. 5. In contrast, Russia, the world’s largest gas producer, has an 82-year supply based on 2000 production rates.
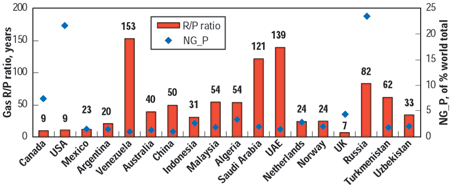 |
FIG. 5. Reserve-to-production ratio of natural gas for selected countries for the year 2000.
|
|
POPULATION TRENDS
Population figures for the last decade for different regions of the world (Fig. 6) show the largest gain in Africa, which has an average yearly growth rate of 3%. During the last 10 years, population growth was lowest (0.25% average yearly growth) in West and East Europe combined. This slow growth rate is mainly attributed to decreasing population in East Europe combined and FSU. The Asia/Pacific region, where about 56% of humans live, has seen the fourth largest population growth (1.6% average yearly growth). Note that the yearly average global population growth rate in the last decade was 1.6%. The effects of population change will be taken into account in the discussion of PEC, GDP and CO2 emissions.
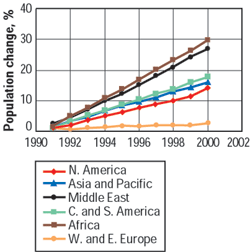 |
FIG. 6. World population change by region (reference year 1990).
|
|
PEC AND GDP
Change in primary energy consumption (PEC) shows faster consumption growth in Asia/Pacific, the Middle East and Central and South America, Fig. 7. Energy consumption decreased in West and East Europe, mainly in East Europe and the FSU.
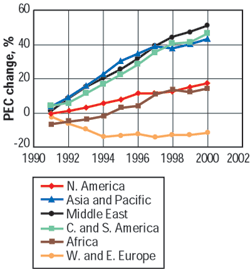 |
FIG. 7. World primary energy consumption change by region (reference year 1990).
|
|
Considering world PEC values by fuel source, it is evident that oil has been the major (39% of yearly total) fuel source the last decade. As mentioned earlier, 85% or more of primary energy consumed in the last decade was produced using fossil fuels. Coal and gas have been the second- and third-largest fuel sources.
A comparison of change in PEC by fuel type, referenced to 1990, shows some interesting results, Fig. 8:
- The rate of change of primary energy consumption attributable to fuel sources such as nuclear and hydro are higher than the three major fuels used in a given year. Though not shown, other renewable energy sources performed similarly.
- The rate of change for gas has been higher than oil or coal.
- The change in PEC attributed to coal, the second-largest fuel source in the world, is lowest.
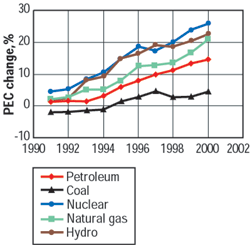 |
FIG. 8. World primary energy consumption change trend by fuel type (reference year 1990).
|
|
Plausible reasons for the observed trends are multi-fold, but include: an overall increase in world energy demand; greater environmental consciousness on the part of many countries; and the recent preference for gas-fired gas turbines as the technology of choice for clean, efficient and easy-to-install power generation plants.
To get a more realistic picture of worldwide energy consumption, it is more appropriate to analyze the PEC data on a per capita basis (PEC_PC) and grouped by two types of countries. Group A countries (Fig. 9) have PEC_PC values greater than 100 million Btu per year (MMBtu/year) and Group B countries (Fig. 10) have PEC_PC values less than 100 MMBtu/year. This approach became necessary because of significant differences in the values of PEC_PC for different countries. The analyzed data revealed that, for both groups, PEC_PC growth rate during the last decade was higher in the Asia/Pacific region and in Central and South America.
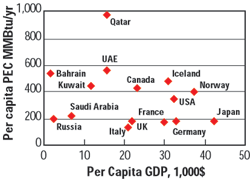 |
FIG. 9. Per capita PEC and GDP for Countries with PEC_PC > 100 MMBtu/Year for 2000.
|
|
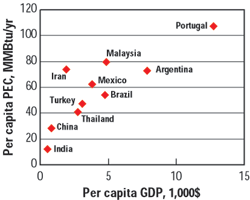 |
FIG. 10. Per capita PEC and GDP for Countries with PEC_PC > 100 MMBtu/Year for 2000.
|
|
The change in values of GDP_PC during the last decade, expressed in 1995 US dollars, shows higher economic growth rate for countries mostly in Asia/Pacific in both groups. Japan, with the highest value of GDP_PC in the last decade, showed relatively smaller economic growth. On the contrary, China, with a value of GDP_PC 1/50th of Japan’s (based on 2000 data), showed the highest economic growth rate in the last decade.
A relationship between the values of PEC_PC and GDP_PC shows the relative status of selected countries of the two groups, Figs. 9 and 10. The two most populated countries of the world, China and India, have the lowest values of PEC_PC, Fig. 10.
In 1968, PEC_PC, and GDP_PC was highest for the US.5 However, as evident in Fig. 9, the US no longer leads in this respect, even though the US is the largest consumer of primary energy and various fuel sources of the world.
OIL AND GAS PRODUCTION AND CONSUMPTION
During the last decade, the Middle East was the largest oil producing area, with its yearly average equaling 30% of the world total. For 2001, the US was the world’s largest oil producer, exceeding even Saudi Arabia.6 In 2001, the US, Saudi Arabia and Russia were the world’s top three oil producers at 9.02, 8.73 and 7.29 million bpd, respectively.
A review of the change in oil production compared to 1990 shows the highest growth took place in Central and South America. Again, compared to 1990, oil production was lower during the entire decade in North America and West and East Europe, particularly in the US and Russia.
During the last 10 years, about 60 – 65% of the world’s oil was consumed by North America and West and East Europe. Considering oil consumption (Oil_C) compared to 1990, the largest oil consumption increase occurred in Asia/Pacific, Fig. 11. The only region where oil consumption decreased compared to 1990 was in West and East Europe, and particularly, in the FSU.
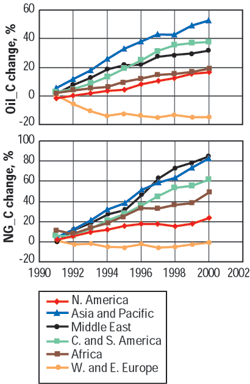 |
FIG. 11. Changes in world oil (top) and gas (bottom) consumption (reference year 1990).
|
|
The largest portion of gas production (40 – 50% of world total) during the last decade came from West and East Europe, particularly the FSU. Second place belonged to North America. However, the largest gas production increase during the last decade came in Asia/Pacific and the Middle East. Despite the fact that West and East Europe had the most gas production during the last 10 years, it is the only region where production declined compared to 1990.
In the past 10 years, some 75 – 80% of the world’s gas consumption (NG_C) occurred in North America and West and East Europe, the same two regions that led in oil consumption. Despite gas consumption being the highest in West and East Europe, it declined overall during the last decade compared to 1990. A larger growth rate in gas consumption has occurred in Asia/Pacific and the Middle East, Fig. 11.
CARBON DIOXIDE EMISSIONS
In terms of absolute levels, the US produced the largest amount (24% of world total) of CO2 emissions in 2000, Fig. 12. Seven out of the world’s 12 largest CO2 emission producers are developed nations. But when comparing emission levels for different countries, absolute CO2 emission values alone are not the appropriate criterion, since total fossil fuel energy consumed should be considered against the CO2 emissions. It would be more appropriate to use either per capita CO2 emissions or to normalize CO2 emissions by energy consumed.
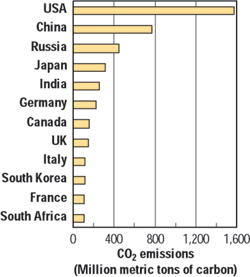 |
FIG. 12. Major CO2 emissions producers of the world for 2000.
|
|
The EIA, has analyzed CO2 emission data by normalizing it with GDP values.2 However, GDP values alone are not complete indicators of energy consumed. A better method is to normalize CO2 emissions with PEC and correlate it with the per capita GDP (GDP_PC).
The resulting chart (Fig. 13) shows not only the cleanliness of the energy resources used by each country, but also the economic growth weighted by population. CO2 emissions per unit PEC can be termed emission intensity. As can be seen for selected countries, Brazil has the cleanest energy production, but with relatively smaller per capita GDP. This is probably due to the country’s large proportion of hydroelectric power. China, on the other hand, has 33% more emission intensity compared to the US, even though its absolute level of CO2 emissions is 50% of that of the US. This may be due to its relatively high reliance on high-sulfur coal for power generation. 
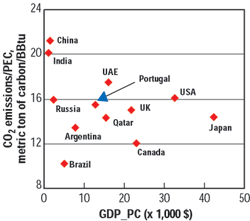 |
FIG. 13. Relationship among CO2 emissions, primary energy consumption and per capita GDP for some countries for the year 2000.
|
|
LITERATURE CITED
1. Annual Energy Review, 2000 – Energy in the United States: 1635 – 2000.
2. International Energy Outlook 2002, Energy Information Administration, Department of Energy, United States.
3. Oil & Gas Journal, Yearly last week issues from 1970 to 2001, Penn-Well Publishing Co.
4. International Energy Database, Energy Information Administration, Department of Energy, United States.
5. Culp, Archie W. Jr., Principles of Energy Conversion, McGraw-Hill Book Co., Chapter 1, 1979.
6. Davis, Michael, “OPEC’s Maneuvering holds market balance – Spare capacity could wallop oil-field firm,” Houston Chronicle, June 25, 2002.
THE AUTHOR
|
 |
Rakesh K. Bhargava, project engineer at Universal Ensco Inc., has been involved for more than 25 years in the design, research, development and applications of gas turbines and other rotating and reciprocating equipment used in the pipeline, petrochemical, power generation and offshore industries. He serves as a turbomachinery consultant worldwide, actively participates at the International Gas Turbine Institute of ASME and currently Chairs the Oil & Gas Applications Committee. He is a Fellow and Associate Fellow of ASME, AIAA, respectively. Dr. Bhargava obtained his PhD (1989) from The City University of New York.
|
| |
|
|


