|
| |
|

By Petroleum Technology Transfer Council |
Oxy Permian’s Cogdell Unit CO2 flood responds rapidly to CO2 injection
The flood is only one year along, but production has already increased from 1,300 to 3,500 bopd
Steve Pennell, Oxy Permian, Houston, and Steve Melzer, Consulting Engineer, Midland, Texas
Oxy Permian, Ltd. (Oxy) is using CO2 flooding to rejuvenate production in the Cogdell Unit, a Pennsylvanian Carbonate Reef field north of Snyder, Texas. Fast response is typical of high permeability reservoirs, but the blessing comes with reservoir management and sweep-intervention challenges to assure that the CO2 sweep is efficient and lasting. Oxy uses an active reservoir surveillance program and makes sweep/profile modifications where necessary. Phase 2 development is planned during 2003. Assuming continuing success of the CO2 flood, field life could be extended 25 years and add over 20 million barrels of oil recovery.
GEOLOGICAL AND LOCAL SETTING
The Cogdell Unit, located about 100 mi NE of Midland, Texas, is part of the larger Horseshoe Atoll Reef Complex, Fig. 1. Several Pennsylvanian Strawn-, Canyon- and Cisco-age fields comprise the complex. Cogdell field consists of two very significant carbonate build-ups platform remnants (island complexes), with a deeper water basin to the east, shallow water shelf to the west, ooid shoals wrapping around the mounds from prevailing winds, and several tidal channels cutting through the platform to isolate the “islands.” The Cogdell Unit covers 15,100 acres (10 mi by 3 mi). Reservoir depth is about 6,800 ft. The field can be subdivided into the North and South Domes with a spine area between them. The North Dome has about 750 ft of structural relief and wells have up to 700 ft of gross pay with 13% average porosity and permeability of 6 md.
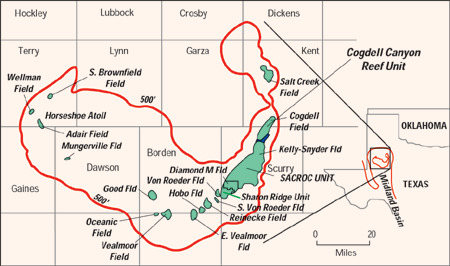 |
Fig. 1. Map of Horseshoe Atoll in West Texas.
|
|
Thin, highly permeable karst zones are present, typically on the tops of carbonate sequences. They present the greatest conformance challenge and are best identified using a CAST-V* tool. Two modern analogs help one understand the field: Andros Island in the Bahamas between Florida and Cuba, and an area of spectacular karst formations and erosional remnants of build-ups limestone towers in the Quilin Province in south central China.
PRODUCTION HISTORY
The production history for the entire Cogdell Unit is shown in Fig. 2. The field was discovered in 1949, unitized in 1955, and peripheral waterflood and crestal gas injection operations began soon thereafter. In the late 1960s, injection moved into the Unit’s interior with the development of 160-acre inverted 9-spot patterns, which were infilled in the mid-1970s to 40-acre 5-spots in the two domes.
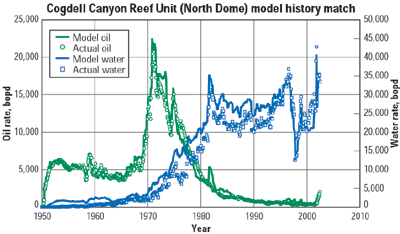 |
Fig. 2. Cogdell Unit production history. Oil production=green; water production=light blue; water injection=dark blue.
|
|
Production peaked at 45,000 bopd in the early 1970s, then established a 13% exponential decline until acquired by Altura in 1998 (Occidental Petroleum Corp. acquired Altura in 2000). The Unit, which was in the latter stages of depletion, produced only about 1,300 bpd at 1.5% oil cut in 1998. It was acquired specifically for CO2 flooding. Altura arrested decline through well workovers and the drilling of several infill wells. The current upward production trend is due to rapid response to CO2 injection, which began in October 2001. As of January 2003, production level was about 3,600 bopd.
During Phase I, CO2 flooding was implemented solely in the North Dome area of the Unit. The flood patterns cover about 1,200 acres, comprising 19 water-alternating-gas (WAG) injectors and 38 producers. The original oil-in-place for the area is about 117 MMbbl of oil. Extensive well work was required, consisting of activating 19 injectors and 34 producers, of which 24 were already active in the waterflood, but half (26) were temporarily abandoned or shut-in.
The Cogdell North Dome Reservoir model comprises 19 geological layers. The grid is 56 x 89 (12,267 ft by 19,649 ft) and covers about 8.6 mi2. A compositional reservoir simulator was used for the modeling, which first concentrated on matching the injection and actual production performance of the 130 wells in the area from discovery through the end of waterflood, Fig. 3.
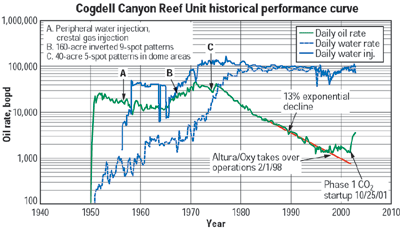 |
Fig. 3. Cogdell North Dome performance history match.
|
|
The rapid production response from the CO2 flood is illustrated in Fig. 4. CO2 injection began on Oct. 25, 2001, and gas breakthrough occurred within a month. Production facilities were not complete, so some wells had to be temporarily shut-in. Rapid production response is somewhat like other nearby Canyon reef floods (SACROC and Sharon Ridge to the south and Salt Creek to the north) but production currently somewhat lags initial modeling forecasts due to gas cycling through the karst layers.
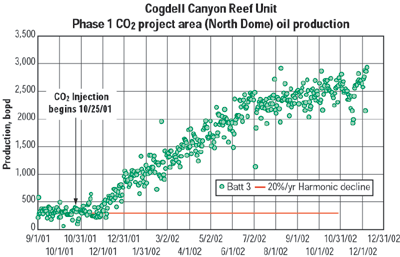 |
Fig. 4. Cogdell North Dome production performance.
|
|
CO2 injection ramped from a starting rate of about 15 MMcfd to the December 2002 rate of about 70 MMcfd. CO2 injection was started at very low WAG ratios for the first two to three months, then rapid gas breakthrough required “wetting-up” the WAG, going to a 0.5:1, to a 1:1 water-to-gas ratio for interior, high-gas-breakthrough wells. Gas production increased fairly rapidly from initial breakthrough to a current rate of about 30 MMcfd. This is faster than predicted and also attributed to the karst intervals. Gas is processed through Kinder Morgan’s SACROC facilities and the Snyder Gas Plant. NGL production has also increased quickly with hydrocarbon GOR. The hydrocarbon gas is very rich, containing about 250 bbl/MMcf, and the gross production rates (including plant share) are currently 1,100 to 1,200 bpd.
CONFORMANCE ISSUES
As is often the case in fast processing reservoirs and as expected here from the onset, the thin karsted intervals are acting as thief zones, causing excessive gas cycling. The gas cycling is impacting oil production by causing less injection into and reduced processing of the main pay layers. Fig. 5 shows an injector-centered pattern in the upstructure, central part of the Phase 1 area.
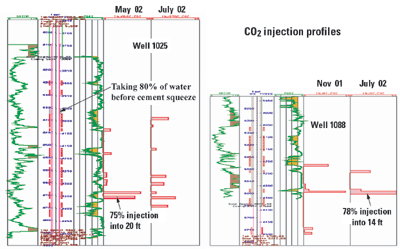 |
Fig. 5. Downhole logs and injection profiles for two North Dome wells.
|
|
The profile on Well 1088 and the earlier profile on Well 1025 show 75 – 80% of the injection into 14- to 20-ft intervals. The second profile on Well 1025 is after increasing the CO2 injection rate to equalize BHP between water and CO2 cycles, which improved the profile. In Well 1025, the interval that was cement squeezed before start of CO2 injection had been taking 80% of the water injection. This, plus other successful examples during waterflooding, provides encouragement that profiles are manageable during CO2 flooding. Very recently, straddle packers were installed in Well 1088 to mechanically isolate the karst zone. Early testing suggests success, but it is too early to determine the long-term effectiveness of this mechanical approach.
Oxy maintains vigilance through its Conformance Improvement Program, which includes:
- Monitor and manage injection rates and pressures to equalize BHPs between water and CO2 cycles.
- Re-stimulate pay sections not shown to be taking fluid on the injection profiles.
- Isolate thief zones using straddle packers.
- Perform squeezes to shut off thief zones if straddle packer installations do not significantly improve pattern performance and when high permeability layers have been predominantly swept.
SUMMARY
The performance of the Phase 1 area has been very encouraging. Production has increased from 300 to 2,700 bopd in 13 months. NGL production, currently at 1,100 bpd, is also a significant contributor. High permeability karst layers have had a greater influence on initial project performance than was originally forecast. This is evidenced by higher than expected gas breakthrough and somewhat lower than forecast oil production, partially offset by higher than expected NGL production. Managing conformance issues will be a challenge and the key to long-term success. Considering Phase 1 performance, the Phase 2 expansion has been approved and CO2 injection will start in the second quarter of 2003. 
THE AUTHORS
|
|
Steve Pennell is the Cogdell reservoir engineer for Oxy Permian where he both designed and continuously evaluates the CO2 flood project. He graduated from Penn State University in 1981 with a BS in Chemical Engineering. He began his career with Amoco Production Co. in Levelland, Texas, and has had a variety of production and reservoir engineering assignments, including work on the early Levelland field CO2 flood pilots. Steve was the reservoir engineer for the Wasson ODC Unit in Wasson field during much of the 1990s, optimizing CO2 flood operations and recommending several expansions to the CO2 flood project. Steve joined Altura Energy, Ltd in early 1997 when Amoco and Shell merged their West Texas assets and formed Altura, which was subsequently acquired by Occidental in 2000.
|
| |
Steve Melzer is a consulting engineer in Midland, Texas, specializing in CO2 flooding. He is the director of the annual CO2 Flooding Conference held each year in December in Midland/Odessa, Texas. He has a BS in geological engineering at Texas A&M and an MS in engineering from Purdue University.
|
| |
|
|


