Exploration
Integrating seismic data processing and visualization
The same display technology and tools that have been developed for interpreters are just as useful in the hands of data processors, especially for such tasks as velocity analysis and data QC
Chris Taylor, PGS Geophysical, London, and David Ellis, BP, Sunbury, UK
The use of visualization systems has largely been confined to geoscience interpreters using post-stack volumes with related datasets and tools. The main aim for interpreters is to obtain a better understanding of the structural content of their datasets, incorporating all the available information in one integrated display. For a long time, the extension of 3D visualization into data processing had been largely unrealizable, due to the volume size, particularly pre-stack, which typically involves orders of magnitude greater than standard data viewing. Recently, cost and time constraints have pushed the incorporation of visualization tools into everyday data processing flows. This has been made more practical when coupled with newer, evolving technologies including Linux clusters that increase the pace of data processing.
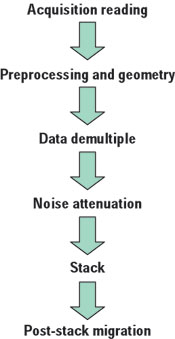 |
Fig. 1. Basic flow for data processing. The steps to the stack comprise both pre- stack and post- stack QC and a number of tests to check the flow parameters. In this flow alone there might be 984 million traces.
|
|
ASSESSING DATA VOLUME SIZE
As the volume of geophysical data increases, automated tools become desirable to help the processor sift through these volumes to find the necessary information. The evolutionary change is illustrated in Fig. 1. Such evolution requires a step change in hi-end visualization development, such that tools designed within visualization software for the data processing environment are integrated.
To get an idea of the size of data, for an average 3D survey of around 2,500 sq km, a 25-m grid would give something like 2,000 inlines by 2,000 crosslines, comprised of 4 million data traces in the stacked volume. For each of these traces in this stacked volume, there exists a pre-stack or CMP gather. If the number of traces, or folds, in the gathers were 60, then the number of traces in a single pre-stack dataset would be 240 million. This is only for one dataset. If, during the life cycle of a data processing flow, we had a simple route (Fig. 1), then we would be handling a minimum of 984 million traces of pre-stack and post-stack data (four processes with pre-stack and post-stack data and two with only post-stack data: 4 X 240 million and 6 X 4 million). From this simplistic flow, one can apply additional processes, resulting in well over a billion traces for one project, to obtain one final stacked volume of four million traces for structural interpretation.
Even with such data volumes, it is now possible for data processors to QC, visualize and interpret seismic data in an immersive, multi-volume and collaborative visualization environment, in real time, enabling rapid, informed, strategic and cost effective decisions. In doing so, they develop a greater alignment with interpreters, viewing and interacting with the seismic data using the same environment and media.
NEW TOOLS FOR DATA PROCESSING
Powerful tools in evaluating and processing seismic data have emerged out of visualization technology development. 3D visualization software has meant that larger amounts of data can be viewed and assessed by geoscientists (geophysical data processors and other geo-disciplines) Table 1. This has led to improving not only the time-cycle for decision-making, but also their assessments and accuracies. This provides analysts with access to high-end 3D visualization tools and displays that enable both interactive picking of processing parameters and data QC.
| |
Table 1. Changes in data volume, processing and computing during the last 20 years. |
|
| |
|
1982 |
1987 |
1992 |
1997 |
2002 |
|
|
|
|
|
| |
Acquired Traces
Per Sq Km |
24,000 |
32,000 |
48,000 |
72,000 |
120,000 |
|
| |
|
|
| |
Standard
Technologies |
FK Filter
NMO |
FK Demultiple
DMO |
FK Demultiple
3D DMO |
Radon
PSTM |
SRME
KPSTM
KPSDM
Anisotropy |
|
| |
|
|
| |
Compute
Technology |
Phoenix
VAX |
VAX, Convex,
IBM MF, IBM RS |
IBM, Fijitsu,
Cray, Intel |
IBM SP
SGI |
IBM SP
PC Cluster |
|
|
|
|
| |
Avg. Center
G Bytes |
1 |
10 |
100 |
1,000 |
35,000 |
|
|
|
|
| |
Avg. Center
G Flops |
0.01 |
0.1 |
1 |
100 |
2,000 |
|
|
With the advent of Linux clusters for data processing, data throughput is greater, and can be controlled and applied globally. Optimization can be achieved more readily within a clustered environment, so that data processing flows are tuned to the pace of human QC capabilities. This is a challenge to the traditional productivity model. Decisions on these datasets within the data processing flow are required before progressing to the next stage in that flow. Therefore, with increased throughputs of data, visualization has come to help with the quality and quantity aspects of the work. The key to the process is being able to customize the software with new tools and, more importantly, to speed up QC capabilities by optimally configuring the software/hardware. Seismic-related activities that benefit from 3D visualization systems are shown in Table 2.
| |
Table 2. Seismic-related activities that benefit from 3D visualization systems. |
|
|
Geophysical data acquisition/ processing QC |
|
Data processing flow comparisons and QC with data toolkits |
|
|
Automated horizon building/ editing |
|
Seismic stacking velocity picking and QC |
|
|
Depth model building and QC |
|
Residual delay analysis/ QC |
|
|
AVO analysis |
|
Data prospect evaluation |
|
|
Rapid noise identification/ elimination |
|
Many data types viewed simultaneously |
|
|
4D (time-lapse) analysis |
|
Multi-component analysis |
|
|
Geophysical attribute analysis and toolkit calculations |
|
Shot record first break picking for statics computations |
|
|
Visualization of multi-client data |
|
Well planning |
|
|
With respect to quality control, any pre- or post-stack dataset can be viewed with associated attributes such as velocity fields. Fig. 2 shows a view of post-stack data that can be combined with pre-stack gathers and velocity information. Other items, such as noise analysis datasets, can be viewed to assess parameters in the data processing flows. Anomalies can be easily located and viewed to focus on possible problem areas, or to highlight areas of geological significance that have been improved in the flows.
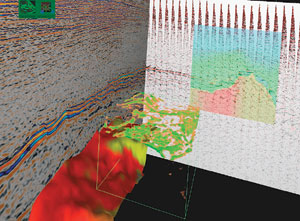 |
Fig. 2. Combining into one integrated view, pre- and post-stack gathers datasets, along with velocity overlays, horizons with extracted amplitudes and transparent volumes. This has become a major advantage for the data processor.
|
|
A major advantage for the processing analyst is to use interpretation aids, such as autopickers or “growers,” to perform water-bottom growing and QC, Fig. 3. These can be used to populate data-processing databases for use in subsequent processing flows. First arrivals on the pre-stack gathers (Fig. 4) can be used for near-surface statics computations – picking horizons as an interpreter would – giving faster turnaround and more accurate solutions. Whatever assessment is performed, users can demonstrate to, and work with, interpreters in a familiar environment, with far more data and with greater speed.
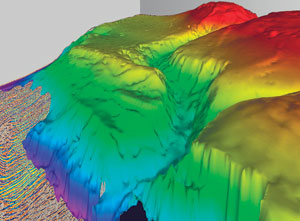 |
Fig. 3. Horizon growing and attribute overlays; in this case time coloring on a complex water-bottom event. The water bottom event is used to populate the database for applications during the processing flow.
|
|
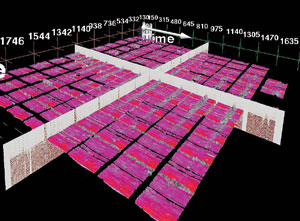 |
Fig. 4. 3D first arrival growing on LMO-corrected shot records for input to near-surface statics computations. Here the events are interpreted in 3D as if they were normal horizons.
|
|
Different “growing” algorithms are available that are both fast and flexible. Procedures are carried out interactively in a 3D environment (stereo or mono). Amplitudes can be extracted from any dataset and draped over the horizon, highlighting where the grower has possibly leg-skipped or miss-interpreted.
The visualization environment benefits depth-model building for depth migrations (such as the newer wave equation routines) in particular, as the process of model building is highly interpretive and QC-orientated within a collaborative setting. By combining into one view, or linking to other software viewers, many data types related to the model building can be viewed, such as gathers, stacks and velocities. This visualization benefit has also expanded into time-processing areas, where interaction is becoming more interpretive for the data processing community.
Subsurface illumination modeling can be used to analyze the effect of different survey parameters and geometries in 3D, along with other datasets and scenarios. This can be used to draw conclusions with respect to optimal data-acquisition geometry, shooting direction or repeatability. In connection with 4D, subsurface illumination modeling may give valuable information about potentially problematic areas between the base and monitor surveys.
One of the key areas of data processing that is potentially time-and resource -consuming is high-resolution velocity analysis of pre-stack data. This pre-stack analysis helps to configure a velocity field, ultimately used for stacking or migrating pre-stack traces to form the post-stack volume. Within this velocity analysis routine, many different datasets are generally viewed simultaneously, including well information. Any anomalies in the velocity analysis can be quickly targeted in the visualization system for further updating. By combining automatic routines with human subjectivity, time can be saved while improving on detail and accuracy. This process is illustrated in Fig. 5.
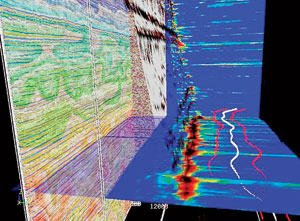 |
Fig. 5. New environment for velocity analysis. Gathers (back left) and stacks are overlaid with velocity fields. Foreground: creating velocity fields based on semblances. Automatically picked stacking velocities are the transparent “curtain” (colored by semblance). These intercept the target horizon (colored by semblance). Interval velocity profile, after smoothing, near the target horizon, is shown in white, together with low- and high-error trends based on standard errors (red).
|
|
The 3D visualization system, although originally designed for interpreters, has proved itself to be an ideal integration engine for seismic data processing. For example, the 3D display allows the co-display of 2D stacks with their associated pre-stack data loaded as pseudo 3D volumes. In this way, stack response can be compared alongside each and every unstacked CMP gather along the line, and also viewed in conjunction with velocity semblances computed continuously at every CMP. This enables fast and fluent QC of the velocity interpretation with all the relevant pre- and post-stack data being available.
Indeed, viewing results from seismic in this way allows velocity trends in the data to speak for themselves. This avoids the danger of relying on purely graphical views of stacking velocity functions, displayed in isolation of the data from which they were picked. If that method was used, no context of the underlying data quality is possible, and the inevitable subjective element of the velocity interpretation cannot be judged.
THE HUMAN FACTOR
With the advent of visualization tools, processors and their clients have been amazed at the additional information they have been able to see and how little time it takes before the datasets can be viewed. Large amounts of data from different domains – both pre- and post-stack – can be displayed, including different versions with alternative flow parameters. Above all, it is creating enthusiasm in users and increased attention to detail.
Clients can save considerable time by rapidly viewing several velocity volumes with related pre-stack and post-stack datasets. The potential to speed up the process to sign off on a processing flow before proceeding to the next stages is great, especially if performed in the client’s own workspace.
Users are able to look at data from a new angle and extract information that was not possible before. This promises a step-change in the way that data processing can work and integrate with other disciplines involved in the life cycle of an oilfield project, from prospect to production.
THE FUTURE
The rate of change in terms of tools and technology is dramatic. Outside the geological/geophysical world, the environment for visualization, in general, is largely influenced by the Internet and computer hardware advances. These influences are already being incorporated in a number of fields within the geosciences arena and will substantially expand within the next few years. This has already been seen in the move toward Internet-based data processing with Application Service Providers and the use of Linux networks and clusters to optimize computation and memory power.
In the not too distant future, velocity analysis will be performed interactively in true 3D mode, showing ray tracing for curved rays in complex models. This will be achieved through linked or integrated environments, and by using the fast and efficient growers available in visualization systems for building velocity models that allow more accurate depth migrations and reservoir characterization.
This has, to a large extent, been fueled by the advent of Linux clusters and the pressure to reduce cycle-time in prospect evaluation, from acquisition to final drilling and production. One major differentiator in this cycle is the inclusion of collaborative visualization. Irrespective of how it is achieved, 3D visualization definitely has a place in seismic data processing. The same display technology and tools that have been developed for interpreters are just as useful in the hands of data processors, especially for tasks such as velocity analysis and data QC that involve a high degree of interpretative input. By using these leading edge visualization systems, processors become aligned with interpreters, looking and interacting with the data, using the same displays and the same level of detail. 
ACKNOWLEDGEMENT
The authors thank PGS and BP for allowing this article to be published.
THE AUTHORS
|
 |
Chris Taylor earned an MSc in geological data analysis and has 24 years of geophysical and software experience. He has worked for a number of companies in acquisition, data processing and model building for PSDM work and software support/training. Now at PGS, London, his interests are visualization, new migration technology and model building.
|
 |
David Ellis earned a BA in geology from Cambridge University. He joined BP in 1985 after spending four years with Petty-Ray Geophysical as a seismic processor. He has continued in seismic processing ever since, working on a variety of 2D and 3D land and marine datasets.
|
| |
|
|

