OUTLOOK 2003: United States
US Rotary Rigs
US Rotary Rigs
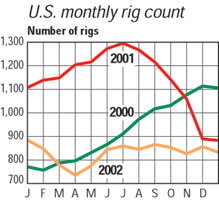
Mediocre, but steady – almost too steady
To put a positive spin on it, the theme for 2002 was stability. Last year began with 883 rigs and finished with 860 rigs. The last half of the year was remarkably flat. Monthly averages from June to year-end varied less than 25 rigs. That kind of stability is what companies ordinarily want; it helps them plan and budget. However, last year’s flat rig count needs to be 50% higher for the industry to use its present capacity.
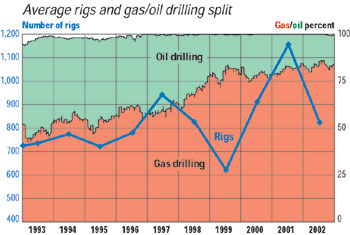
A noteworthy feature shown in the graphs below is that the US almost doesn’t drill for oil anymore. As of mid-September 2002, 86.4% of all US rotary rigs were drilling for gas – an all-time high.
Nearly all areas saw 20 – 30% declines, in line with the overall 28% drop for the nation. Areas with the appearance of huge percentage losses are due to the small number of rigs in the area. The only two exceptions to this were Kansas, which fell from an average 22.4 rigs in 2001 to only 7.5 rigs last year, and Texas District 9, which saw an increase of 9.5%. District 9, near Dallas, has been a perennial bright spot, and has grown each of the last 6 years, from 6 rigs in 1996, to averaging 30 rigs in 2002. Gas drilling in the Barnett Shale is the main reason.
The industry seemed balanced between fear and hope throughout the past year. World Oil’s forecast calls for 30,487 wells to be drilled in the US in 2003, a 5.5% increase over last year’s 28,901 wells. We estimate that this will require an average of 870 rigs. 
| |
Average number of US rotary rigs in operation1 |
|
| |
State or area |
2002
Avg. |
2001
Avg. |
% Diff. |
|
|
|
|
| |
Alabama – Onshore |
1.0 |
1.7 |
–41.2 |
|
| |
Alabama – Offshore |
2.0 |
3.7 |
–45.4 |
|
| |
Alaska – Onshore |
9.7 |
11.8 |
–17.5 |
|
| |
Alaska – Offshore |
1.5 |
1.6 |
–6.3 |
|
| |
Arkansas |
0.8 |
1.6 |
–48.3 |
|
| |
California – Onshore |
19.7 |
32.4 |
–39.3 |
|
| |
California – Offshore |
2.6 |
3.9 |
–33.4 |
|
| |
Colorado |
27.8 |
32.2 |
–13.7 |
|
| |
Kansas |
7.5 |
22.4 |
–66.4 |
|
| |
Kentucky |
4.8 |
6.4 |
–24.9 |
|
| |
Loiusiana total |
162.7 |
213.7 |
–23.9 |
|
| |
|
North |
23.0 |
30.2 |
–23.8 |
|
| |
|
Inland water |
16.0 |
20.5 |
–22.0 |
|
| |
|
South |
32.0 |
44.0 |
–27.3 |
|
| |
|
Offshore |
91.7 |
119.0 |
–22.9 |
|
| |
Michigan |
1.3 |
1.2 |
8.3 |
|
| |
Mississippi |
7.5 |
14.2 |
–47.3 |
|
| |
Montana |
7.9 |
10.0 |
–20.8 |
|
| |
Nebraska |
0.1 |
0.2 |
–51.9 |
|
| |
New Mexico |
41.5 |
68.0 |
–39.1 |
|
| |
New York |
4.3 |
5.4 |
–20.6 |
|
| |
North Dakota |
10.1 |
14.3 |
–29.5 |
|
| |
Ohio |
8.7 |
9.6 |
–9.9 |
|
| |
Oklahoma |
90.9 |
130.0 |
–30.1 |
|
| |
Pennsylvania |
10.3 |
10.5 |
–1.5 |
|
| |
South Dakota |
0.2 |
0.6 |
--- |
|
| |
Texas total |
340.9 |
462.0 |
–26.2 |
|
| |
|
Texas offshore |
14.8 |
25.0 |
–40.8 |
|
| |
|
Inland water |
2.0 |
1.4 |
42.9 |
|
| |
|
District 1 |
8.0 |
6.1 |
31.1 |
|
| |
|
District 2 |
21.0 |
24.5 |
–14.3 |
|
| |
|
District 3 |
40.0 |
60.8 |
–34.2 |
|
| |
|
District 4 |
74.0 |
82.5 |
–10.3 |
|
| |
|
District 5 |
38.0 |
58.5 |
–35.0 |
|
| |
|
District 6 |
31.0 |
47.5 |
–34.7 |
|
| |
|
District 7B |
1.0 |
1.5 |
–33.3 |
|
| |
|
District 7C |
21.0 |
30.1 |
–30.2 |
|
| |
|
District 8 |
31.1 |
56.1 |
–44.6 |
|
| |
|
District 8A |
14.0 |
19.4 |
–27.8 |
|
| |
|
District 9 |
30.0 |
27.4 |
9.5 |
|
| |
|
District 10 |
15.0 |
21.0 |
–28.6 |
|
| |
Utah |
13.1 |
20.7 |
–36.9 |
|
| |
Virginia |
1.9 |
2.1 |
–7.5 |
|
| |
West Virginia |
13.2 |
18.0 |
–26.7 |
|
| |
Wyoming |
40.2 |
54.9 |
–26.9 |
|
| |
Others2 |
0.5 |
2.0 |
--- |
|
| |
|
|
| |
TOTAL U.S. |
832.7 |
1155.2 |
-27.9 |
|
| |
Totals may not add due to rounding
1Source: Baker Hughes
2Includes Arizona, Florida, Hawaii, Maryland, Nevada, Oregon, Tennessee and Washington |
|
|
|