OUTLOOK 2003: United States
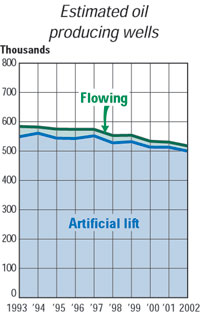
Producing Oil Wells
Industry cost cutting hits older fields
US operators across the board continued to trim operating costs in 2002 by shutting in low-volume oil wells. Cutbacks reported by state agencies and those estimated by World Oil are moderate, percentage-wise, totaling – 2.0%, or 10,843 wells total. Texas reported a 1.1% drop of 1,675 wells, compared to a 5,136-well increase in 2001. And modest increases in the two largest Districts, 8 and 8A, tempered the overall state drop – both areas have strong secondary recovery projects underway. Other Texas areas with long-established oil producers, many in stripper-well status, saw declining oil-well numbers.
Elsewhere, states with large numbers of oil wells and high percentages of strippers, such as Oklahoma, down 3% to 81,724 wells; Kansas, down 2.7% to 41,207; Kentucky, down 3.5% to 28,522; Ohio, down 2.7% to 28,309; and North Louisiana, down 1.6% to 26,814, suffered the combined negative effects of drilling cutbacks from 2001’s temporary surge and slow recovery of below $20 crude prices at year-end 2001.
The Rocky Mountain states of Colorado, Wyoming and Montana are estimated to have shut-in, at least temporarily, 2.5%, 3.0% and 4.2% of their older wells, respectively. Southeast New Mexico, however, kept most of its wells. In the Midwest, small cuts were reported in Illinois, down 2.8% to 17,410; Indiana dropped 502 wells to 4,747; and Michigan reported a small increase to 3,730. Pennsylvania, is estimated to have dropped 419 wells to 16,331 producers.
While oil-well drilling may be slow to turn around in older US fields in 2003, the prospect for higher crude prices is more positive in reaction to depleting oil stocks and uncertain international events adversely affecting US imports from the Middle East and Venezuela. Smaller operators in many US fields may be turning on their pumping units on thousands of shut-in wells in the near future. 
| |
Estimated US wells producing oil at the end of 2002 |
|
| |
|
Oil wells – 2002
|
Total oil
wells, 2001 |
% Diff.,
2002–2001 |
|
| |
State or district |
Flowing |
Artificial
lift |
Total
wells |
|
|
|
|
| |
Alabama |
47 |
765 |
812 |
823 |
–1.3 |
|
| |
Alaska* |
629 |
1,451 |
2,080 |
2,059 |
1.0 |
|
| |
|
Onshore |
629 |
1,268 |
1,897 |
1,877 |
1.1 |
|
| |
|
State waters |
0 |
183 |
183 |
182 |
0.5 |
|
| |
Arizona |
0 |
20 |
20 |
25 |
–20.0 |
|
| |
Arkansas* |
58 |
6,877 |
6,935 |
7,150 |
–3.0 |
|
| |
California** |
795 |
41,918 |
42,713 |
43,078 |
–0.8 |
|
| |
Colorado* |
0 |
5,643 |
5,643 |
5,788 |
–2.5 |
|
| |
Federal OCS* |
1,489 |
2,140 |
3,629 |
3,792 |
–4.3 |
|
| |
|
GOM |
1,449 |
1,717 |
3,166 |
3,312 |
–4.4 |
|
| |
|
Pacific |
40 |
423 |
463 |
480 |
–3.5 |
|
| |
Florida* |
0 |
73 |
73 |
72 |
1.4 |
|
| |
Illinois |
10 |
17,400 |
17,410 |
17,912 |
–2.8 |
|
| |
Indiana* |
0 |
4,747 |
4,747 |
4,874 |
–2.6 |
|
| |
Kansas* |
0 |
41,207 |
41,207 |
42,350 |
–2.7 |
|
| |
Kentucky* |
7 |
28,515 |
28,522 |
29,557 |
–3.5 |
|
| |
Louisiana* |
2,077 |
24,737 |
26,814 |
27,250 |
–1.6 |
|
| |
|
North |
809 |
20,184 |
20,993 |
21,255 |
–1.2 |
|
| |
|
South |
1,128 |
3,936 |
5,064 |
5,210 |
–2.8 |
|
| |
|
State waters |
140 |
617 |
757 |
785 |
–3.6 |
|
| |
Michigan |
370 |
3,360 |
3,730 |
3,700 |
0.8 |
|
| |
Mississippi* |
258 |
1,216 |
1,474 |
1,484 |
–0.7 |
|
| |
Missouri |
0 |
364 |
364 |
332 |
9.6 |
|
| |
Montana* |
144 |
2,835 |
2,979 |
3,110 |
–4.2 |
|
| |
Nebraska* |
0 |
1,155 |
1,155 |
1,176 |
–1.8 |
|
| |
Nevada* |
25 |
40 |
65 |
67 |
–3.0 |
|
| |
New Mexico |
2,115 |
15,961 |
18,076 |
18,158 |
–0.5 |
|
| |
|
North/West |
505 |
1,224 |
1,729 |
2,110 |
–18.1 |
|
| |
|
South/East |
1,610 |
14,737 |
16,347 |
16,038 |
–1.9 |
|
| |
New York |
0 |
2,703 |
2,703 |
2,876 |
–6.0 |
|
| |
North Dakota* |
182 |
3,060 |
3,242 |
3,395 |
–4.5 |
|
| |
Ohio* |
71 |
28,238 |
28,309 |
29,095 |
–2.7 |
|
| |
Oklahoma* |
0 |
81,724 |
81,724 |
84,252 |
–3.0 |
|
| |
Pennsylvania* |
0 |
16,331 |
16,331 |
16,750 |
–2.5 |
|
| |
South Dakota |
0 |
155 |
155 |
155 |
0.0 |
|
| |
Tennessee |
0 |
510 |
510 |
550 |
–7.3 |
|
| |
Texas |
7,800 |
149,765 |
157,565 |
159,240 |
–1.1 |
|
| |
|
District 1 |
339 |
16,685 |
17,024 |
17,260 |
–1.4 |
|
| |
|
District 2 |
209 |
1,797 |
2,006 |
2,087 |
–3.9 |
|
| |
|
District 3 |
1,107 |
6,798 |
7,905 |
8,129 |
–2.8 |
|
| |
|
District 4 |
209 |
1,970 |
2,179 |
2,281 |
–4.5 |
|
| |
|
District 5 |
125 |
2,640 |
2,765 |
2,568 |
7.7 |
|
| |
|
District 6 |
614 |
8,073 |
8,687 |
8,494 |
2.3 |
|
| |
|
District 7B |
497 |
11,001 |
11,498 |
11,975 |
–4.0 |
|
| |
|
District 7C |
998 |
10,406 |
11,404 |
11,557 |
–1.3 |
|
| |
|
District 8 |
2,355 |
36,390 |
38,745 |
38,616 |
0.3 |
|
| |
|
District 8A |
397 |
21,415 |
21,812 |
21,424 |
1.8 |
|
| |
|
District 9 |
755 |
22,341 |
23,096 |
24,089 |
–4.1 |
|
| |
|
District 10 |
195 |
10,249 |
10,444 |
10,760 |
–2.9 |
|
| |
Utah* |
53 |
1,874 |
1,927 |
1,960 |
–1.7 |
|
| |
Virginia* |
0 |
8 |
8 |
8 |
0.0 |
|
| |
West Virginia* |
190 |
7,838 |
8,028 |
8,450 |
–5.0 |
|
| |
Wyoming* |
320 |
9,535 |
9,855 |
10,160 |
–3.0 |
|
|
|
|
| |
Total U.S. |
16,640 |
502,165 |
518,805 |
529,648 |
–2.0 |
|
| |
*World Oil estimate
**Includes state waters |
|
|
|