OUTLOOK 2003: United States
Producing Gas Wells
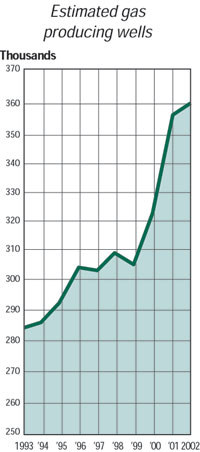
Gas wells remain valuable properties
A small 0.2% increase in US total gas wells raised the 2002 count by 744 wells to 357,511. Statistics from Wyoming prompted a significant increase in gas well numbers reported for that state a year ago, plus an estimated 2.5% increase to 23,862 gas wells in 2002. Campbell County’s coalbed methane surge is a major contribution to this increase.
Texas reported increases in all but three districts for a 4.3% increase to 63,390 wells. District 4, in the southern tip bordering Mexico, continued its annual increases with a 3.5% rise to 10,055; 7C, in West Central Texas, jumped 5.2% to 9,447; District 6 rose 5.5% to 8,390; while neighboring North Louisiana is estimated to have increased by 3.9% to 13,890 gas wells. A 9.9% drop in District 10, in the Texas panhandle, lowered its gas wells to 9,059. Other states with major gas-well counts are: West Virginia, up 2.0% to 39,592; Pennsylvania, up 2.4% to 35,701; Ohio, up 4.0% to 35,303; and Oklahoma, up 2.0% to 33,608. Kansas, Kentucky and North Louisiana remain major gas-well contributors.
Coalbed methane wells included in the totals significantly affect Rocky Mountain state gas-well counts. Examples are seen in Colorado’s 16,209 well count and Wyoming’s major CBM contribution, as noted. The Colorado state agency says 2,224 of the total well count are CBM wells. Northwest New Mexico is also a major CBM producing area. State data for this particular area indicates 16,671 gas wells in 2002; World Oil estimates for 2001 of higher levels results in an anomalously high drop of 23.0%. CBM permitting continues at a strong pace, and such shallow wells can be drilled in a few days in some areas.
US natural gas prices have recovered from below $2.00 levels of 1st quarter 2002, to over $4.00 at year end. January 2003 cold weather in the Northeast has boosted gas prices and will further deplete any storage. With more than 80% of US active rigs drilling for gas, vs. oil, the trend is for continued emphasis on gas. Imports continue from Canada, as do limited exports to Mexico; and the reserve life index for new gas fields found in the US is low, with smaller discoveries depleting as much as 50% in the first year. Lacking major inroads by LNG imports, which will not happen quickly, US gas wells will continue to be valuable properties. 
| |
Estimated US wells producing gas at the end of 2002 |
|
|
| |
State or district |
Total Gas Wells |
% Diff.,
2002 – 2001 |
|
| |
2002 |
2001 |
|
|
|
|
| |
Alabama |
3,814 |
3,649 |
4.5 |
|
| |
|
Onshore |
3,766 |
3,605 |
4.5 |
|
| |
|
State waters |
48 |
44 |
9.1 |
|
| |
Alaska* |
130 |
126 |
3.2 |
|
| |
|
Onshore |
115 |
110 |
4.5 |
|
| |
|
State waters |
15 |
16 |
–6.3 |
|
| |
Arizona |
8 |
8 |
0.0 |
|
| |
Arkansas* |
4,922 |
4,825 |
2.0 |
|
| |
California** |
1,065 |
1,050 |
1.4 |
|
| |
Colorado |
16,209 |
13,283 |
22.0 |
|
| |
Federal OCS* |
3,145 |
3,290 |
–4.4 |
|
| |
|
GOM |
3,123 |
3,270 |
–4.5 |
|
| |
|
Pacific |
22 |
20 |
10.0 |
|
| |
Illinois |
225 |
250 |
–10.0 |
|
| |
Indiana* |
1,482 |
1,439 |
3.0 |
|
| |
Kansas* |
15,925 |
16,250 |
–2.0 |
|
| |
Kentucky |
14,367 |
19,387 |
25.9 |
|
| |
Louisiana* |
16,988 |
16,350 |
3.9 |
|
| |
|
North |
13,890 |
13,407 |
3.6 |
|
| |
|
South |
2,639 |
2,533 |
4.2 |
|
| |
|
State waters |
459 |
410 |
12.0 |
|
| |
Maryland |
9 |
7 |
28.6 |
|
| |
Michigan |
7,680 |
7,600 |
1.1 |
|
| |
Mississippi* |
856 |
811 |
5.5 |
|
| |
Missouri |
49 |
43 |
14.0 |
|
| |
Montana* |
3,844 |
3,725 |
3.2 |
|
| |
Nebraska* |
100 |
96 |
4.2 |
|
| |
Nevada* |
4 |
4 |
0.0 |
|
| |
New Mexico* |
22,362 |
27,175 |
–17.7 |
|
| |
|
North/West |
16,671 |
21,650 |
–23.0 |
|
| |
|
South/East |
5,691 |
5,525 |
3.0 |
|
| |
New York |
5,451 |
5,678 |
–4.0 |
|
| |
North Dakota* |
145 |
130 |
11.5 |
|
| |
Ohio* |
35,303 |
33,945 |
4.0 |
|
| |
Oklahoma* |
33,608 |
32,949 |
2.0 |
|
| |
Oregon* |
18 |
17 |
5.9 |
|
| |
Pennsylvania* |
35,701 |
34,864 |
2.4 |
|
| |
South Dakota |
70 |
65 |
7.7 |
|
| |
Tennessee |
350 |
400 |
–12.5 |
|
| |
Texas |
63,390 |
60,798 |
4.3 |
|
| |
|
District 1 |
3,214 |
1,950 |
64.8 |
|
| |
|
District 2 |
2,587 |
2,583 |
0.2 |
|
| |
|
District 3 |
3,423 |
3,402 |
0.6 |
|
| |
|
District 4 |
10,055 |
9,715 |
3.5 |
|
| |
|
District 5 |
2,733 |
2,273 |
20.2 |
|
| |
|
District 6 |
8,390 |
7,954 |
5.5 |
|
| |
|
District 7B |
5,766 |
5,814 |
–0.8 |
|
| |
|
District 7C |
9,447 |
8,981 |
5.2 |
|
| |
|
District 8 |
3,386 |
3,295 |
2.8 |
|
| |
|
District 8A |
217 |
211 |
2.8 |
|
| |
|
District 9 |
5,113 |
4,563 |
12.1 |
|
| |
|
District 10 |
9,059 |
10,057 |
–9.9 |
|
| |
Utah* |
3,377 |
3,177 |
6.3 |
|
| |
Virginia* |
3,460 |
3,280 |
5.5 |
|
| |
West Virginia* |
39,592 |
38,816 |
2.0 |
|
| |
Wyoming* |
23,862 |
23,280 |
2.5 |
|
|
|
|
| |
Total U.S. |
357,511 |
356,767 |
0.2 |
|
| |
*World Oil estimate
**Includes state waters |
|
|
|