Exploration
How to estimate pore pressure from seismic velocities
In West Cameron, offshore Louisiana, acoustic velocity and tomographic migration velocity analysis were used to determine formation pore pressures
John Smythe and Paul Docherty, Fairfield Industries; Dennis Loren and Rick Box, Loren and Associates
Pore-pressure prediction has applications in analysis of hydrocarbon migration and seal capacity, determination of reservoir drive and connectivity, analysis of drilling hazards (i.e., shallow water flows) and well casing design. Given the water depths, drill depths and well costs that challenge operators in the Gulf of Mexico and around the world, pore-pressure prediction should be an integral part of prospect evaluation and well planning.
In four West Cameron blocks in the Gulf (Fig. 1), Fairfield Industries produced a 3D prestack depth migration using velocities derived by tomographic migration velocity analysis (MVA). In the same area, Loren and Associates undertook a nine-well study to relate log-derived acoustic velocity to formation pore pressure. The relationship, when applied to the tomographic velocities, can predict pore pressure throughout the 3D depth migrated seismic volume.
 |
Fig. 1. Location map showing calibration wells and PSDM area.
|
|
INTRODUCTION
The primary variable that relates velocity to fluid pressure is effective stress, which is the amount of overburden pressure that is supported by the rock matrix. The trend of effective stress vs. compressional transit time depends on lithology and must be locally calibrated. Overburden pressure is the combined weight of the water column above the sea floor, the rock matrix, and the fluid in the pore space above the zone of interest. Overburden pressure is a log-derived property obtained from integrating the carefully edited and continuous density log for the entire length of the well bore.
Pore pressure is equal to the overburden pressure minus the effective stress. Compressional acoustic velocity has been found to be dependent on effective stress, after accounting for variations in lithology and depth (pressure-velocity calibration). Correctly edited sonic and density logs define the specific fluid pressure-velocity relationships applicable to the project area. Using this relationship, seismic velocities can be used to predict pore pressure.
Clearly, successful seismic pore-pressure prediction depends on reliable well log data, careful pressure-velocity calibration, and dense and accurate seismic velocity analysis. In this study, a quality pore-pressure prediction was assured through five key steps:
- Multi-well editing (log data editing) and calibration
- Derivation of overburden pressure and effective stress in calibration wells
- Determination of velocity/effective stress transform
- Tomographic migration velocity analysis
- Application of velocity/effective stress transform to seismic velocities.
LOG QUALIFICATION AND EDITING
For many wells, sonic and density logs are often unavailable or unreliable due to borehole conditions (rugosity, stress relaxation, alteration during prolonged periods of exposure to drilling fluids, etc.). Accurate and continuous sonic and density logs are fundamental to pore-pressure prediction. To overcome logging problems, Loren & Associates developed a multi-well, multi-log editing process called Log Purification. The process uses redundancy between log curves to produce sonic, density and pressure curves representative of undisturbed conditions.
The technique uses mathematical regression over all zones of valid well log data in all wells. This results in the simultaneous deduction of relationships between functions of compressional velocity, density, fluid pressure, lithology, deep resistivity and depth. A simulated version of any log curve (sonic, density, etc.) can then be constructed from the other curves. Intervals of questionable log data can be recognized and replaced with calculated data, while intervals of missing data may be filled in. This methodology is an improvement on traditional log editing techniques that fail to recognize calibration differences between wells. Fig. 2 is an example of a log before and after the purification process. Fig. 3 is a typical log curve set generated for each calibration well.
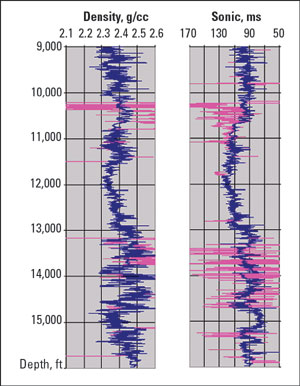 |
Fig. 2. Well logs before (purple) and after (blue) editing process.
|
|
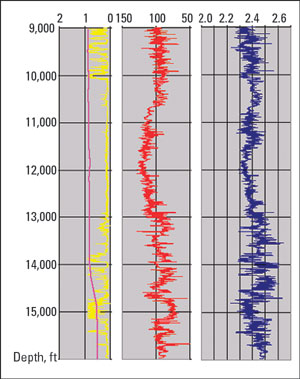 |
Fig. 3. Typical well log suite generated from editing process. Logs include fluid pressure (pink), lithology fraction (yellow), sonic (red), and density (blue).
|
|
PRESSURE-VELOCITY CALIBRATION
Formation fluid pressures are not accurately known at most points in the well. Fluid pressures within shales and untested sands must be inferred from drilling performance, log relationships, and fluid pressures measured within adjacent permeable formations. One product of the Purification process is a continuous fluid-pressure-gradient profile.
Compressional velocities in a given study area depend on effective stress, lithology and depth. Traditional approaches to pore-pressure prediction (Eaton’s method, for example) depend on extrapolating velocity trends in normally pressured rocks to approximate depth effects. Constant lithology, usually shale, is assumed in order to arrive at velocity as an approximate function of effective stress. The extrapolation can be problematic if the data is poor or the distance too great. In addition, local geologic conditions, such as unconformities, may interrupt petrophysical continuity.
Since this method differentiates based on lithologies, an interpreter may study the effects of various lithology assumptions on the pore-pressure prediction. End- member cases of pure shale and pure sand, as well as an estimated case based on lithologies of nearby wells, offer the advantage of visualizing and dealing with uncertainties in pressure prediction caused by uncertainties in lithology.
TOMOGRAPHIC MIGRATION VELOCITY ANALYSIS
Conventional seismic velocity analyses assume that velocity varies slowly both laterally and in depth; or worse still, that the earth is composed entirely of flat-lying layers. Resolution obtained from these methods is often too low for accurate pore-pressure prediction. Tomographic MVA, on the other hand, correctly accounts for distortions in seismic waves brought about by rapid variations in geology. The basis of the technique is straightforward enough: A point in the subsurface of the earth should image at the same depth when seismic waves from different offsets are depth migrated. Deviations in the imaged depth can be converted into errors in traveltime through the earth model. The model is then updated to minimize these traveltime errors.
Tomography is the approach that was used to update the model. Given the traveltime errors between many thousands of imaged points at depth and, typically, equally many seismic sources and receivers on the earth’s surface, a large system of equations is solved simultaneously. The equations describe the paths that sound takes through the earth, while the unknowns are the rock velocities through which sound has passed. It is not uncommon for this system to contain tens, or even hundreds, of millions of equations. A so-called global solution is obtained, that is, the entire earth model is updated, unlike the more common layer-stripping or top-down approaches.
EXAMPLE: WEST CAMERON, OFFSHORE LOUISIANA
A four-block area of seismic data in West Cameron was selected for prestack depth migration. The migration velocities were extracted from the data volume at the calibration well locations. Figure 4 is a comparison between well velocity and the extracted MVA velocity after several iterations of tomography. The MVA produced a smoother velocity but matched the overall trend of the well velocity. It is likely that further iterations of tomography, targeted at data from the neighborhood of the pressure transition at 11,000 ft, would improve the match.
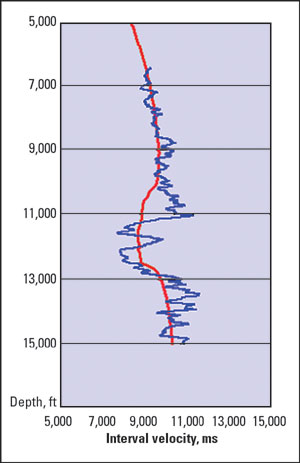 |
Fig. 4. Well velocity (blue) compared with extracted tomographic velocity (red).
|
|
Fig. 5 and 6 are inline extractions from the velocity model and resulting pore-pressure volume through one of the calibration wells. A sonic log and fluid pressure gradient curve clearly show a pressure transition at 11,000 ft. This abrupt pressure transition occurred when the well bore intersected a pressure-sealing fault. The line also shows a pressure anomaly in the productive fault block. The high-pressure anomalies associated with the field pays can enhance understanding of hydrocarbon distribution throughout the reservoir.
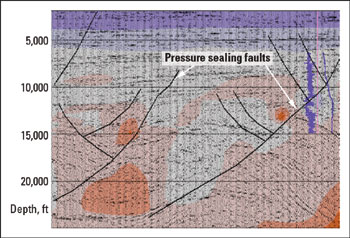 |
Fig. 5. Tomographic MVA volume.
|
|
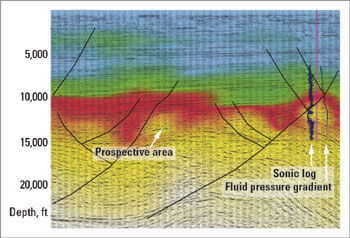 |
Fig. 6. Pore-pressure volume.
|
|
CONCLUSIONS
The problem of relating formation fluid pressure to log-derived velocity, and by extension to seismic velocities, requires consideration of several important points:
- Formation fluid pressures are not accurately known at most points in the well. Wireline formation tests, drill stem tests and production tests are absolute measurements of fluid pressures but only available in discrete and isolated points in the well. However, fluid pressures within shales and untested sands can be inferred by log relationships during the Log Purification phase.
- Recorded density and acoustic transit time logs are often not available throughout the entire borehole. Additionally, recorded data may be inaccurate due to borehole-related problems or calibration errors. Defining pressure/velocity relationships and overburden pressure profiles from acoustic transit time and density logs requires careful log reconstruction.
- The relationship between compressional velocity and effective stress depends on depth and lithology. Traditional methods assume constant lithology, making the task of interpreting them problematic. Traditional methods also extrapolate velocity trends based on the normally-pressured portion of the well, which can lead to error.
The quality of the pore-pressure prediction is directly relatable to the quality of the seismic velocity analysis. The tomographic velocity method used herein is superior to traditional migration velocity analysis. Using this tomographic MVA, together with Log Purification and calibration techniques, a pore-pressure volume in an area in West Cameron, offshore Louisiana, was successfully predicted. The volume can help predict drilling hazards, reservoir pressure distribution and fault-seal capacity. 
THE AUTHORS
|
| |
John Smythe is manager of software development for Fairfield Industries. He has worked as an exploration geophysicist for Enron Oil and Gas Co., Cox and Perkins Exploration and British Petroleum. He earned an undergraduate degree in geology from Boston University and an MS from Rensselaer Polytechnic Institute.
|
|
Dennis Loren has provided petrophysical and earth science consulting services through Loren & Associates, Inc., since 1979. He earned an MS degree in geophysics from the University of Minnesota. He held various petrophysical and engineering assignments with Shell Oil Co. for the first 18 years of his professional career, including engineering manager of the Western Production Division and petroleum engineering research manager. Loren & Associates, Inc., has a strong emphasis on seismic calibration projects, and has conducted pressure prediction projects for clients throughout the world.
|
|
Paul Docherty is a graduate of Oxford University and earned a PhD in geophysics from the Colorado School of Mines. He did postdoctoral research at the Amoco Research Center in Tulsa and at Cambridge University. Since joining Fairfield Industries in 1996, his focus has been depth imaging and seismic velocity determination.
|
| |
Richard Box held various geophysical positions for Phillips, British Gas, Fletcher Challenge, Jason Geosystems and other companies after joining the industry in 1978. His work has always included stressing the importance of an accurate tie to well data as a basis for seismic interpretation. He has MS degrees in geophysics and math from the University of Missouri at Rolla.
|
|

