Using a unique high-resolution imaging process to find pay
GEOLOGICAL AND GEOPHYSICAL APPLICATIONSUsing a unique high-resolution imaging process to find payInterpretation of high-resolution 3-D seismic imaging integrated with AVO processing and existing well log control resulted in identification of bypassed pay in a mature field areaStuart Hirsch, Cabot Oil & Gas Corp., Houston, and Gary Perry, Geotrace Technologies, Inc., Houston Traditionally, integration of conventional, pre-stack time-migrated seismic data with detailed interpretations of existing well log control have resulted in the information used to design development plans for newly discovered hydrocarbon accumulations. Through time, wells are drilled to optimally recover these accumulations and several generations of interpretations are produced and refined as a result of the introduction of new data, development of new or enhanced interpretation techniques, or simply by re-evaluating the available well log data under a new or different paradigm. In many mature field areas, the remaining potential becomes difficult to define and, at this point, the field becomes a candidate for divestiture or abandonment. The use of high-frequency seismic imaging as a stratigraphic discrimination tool and the employment of Amplitude vs. Offset (AVO) products as risk reduction tools for the presence (or absence) of hydrocarbon accumulations permits the identification of potential by-passed production opportunities. This article details the use of this high-frequency technique in the case study of Lake Pelto field. Background Lake Pelto field (Fig. 1) is located about 75-mi southwest of New Orleans, Louisiana, in the state waters area of Terrebonne Parish. Discovered in 1929 by the Texas Co. (Texaco) as Well B-1 State-Lake Pelto (TD of 1,391 ft), the field has yielded in excess of 450 Bcf gas and 122 million bbl oil from multiple pay zones in the Pleistocene through the upper Miocene Textularia "W" (Tex. W).1 More than 300 wells have been drilled for the exploitation of both sulphur and hydrocarbon resources. Sun Oil Co. S/L 2620 Well 16, with an MD of 21,509 ft, is the deepest well drilled to date on the Lake Pelto feature.
Principal development of the salt dome feature was carried out by the Texas Co. between 1929 and the late 1950s. A later period of development (1955 to 1997) was subsequently carried out by Sun Oil and Oryx in off-structure areas to the east and northeast of the earlier field development on State Lease 2620. The latest development has been undertaken by Cabot Oil and Gas Corp., which purchased the Oryx (Sun) leases and production in 1998, and subsequently entered into additional leases with the State of Louisiana. Cabot has drilled four wells since acquiring an interest in the field area. Geological Summary From a regional perspective, the Lake Pelto field area is located within the Upper Miocene Distal-Deltaic Sandstone Subplay.2 It falls within an area of thick Miocene sedimentation known as the Terrebonne Trough, which is characterized by major salt withdrawal basins, adjoining salt piercement features and regional to subregional growth fault systems. Lake Pelto field proper is itself a salt-piercement feature, with salt rising to within 1,500 ft of the surface. The deepest salt penetrated is at 11,680 ft. Faulting is complex and difficult to map in the immediate crestal area and as one nears the steep flanks of the domal feature. At increasing distances to the east of the dome, faulting above the Cibicides carstensi (Cib. carst.) is minor, while faulting below the Cib. carst. is more common. Deep-seated, shale-cored ridges extend both eastward and northward from the dome into the major withdrawal basin that adjoins the domal area. Major faults are associated with both ridges. One fault system extends 2 mi northward to Bay Saint Elaine field. These faults extend high up in the stratigraphic section. Faulting to the east dies rapidly away from the dome and does not extend above the Cib. carst. at increasing distance from the dome. The shale section marks the onset of hard geopressure and ranges, from a depth of 11,500 ft near the dome to more than 19,000 ft off the structure’s east flank. Depositional environments range from inner to middle shelf in the upper Miocene Bigenerina A (Big. A) to outer shelf and upper slope in the upper Miocene Textularia "L" (Tex. L). The Big. A and younger section is dominantly a sandy interval with few shale breaks, while below the Big. A and extending down to the Tex. L, the section is dominated by cyclical, coarsening-upward sequences characterized by thick, basal shale units. A major unconformity is evident in the Cib. carst. section off the east flank of the Lake Pelto dome. Production depths range from less than 1,500 ft in the Pleistocene to deeper than 17,000 ft in the upper Miocene. Gas production dominates below 15,000 ft and at increasing distances from the dome. Most oil and gas accumulations are associated with structural traps, although an increasing stratigraphic component is evident in areas drilled by Sun (and Oryx) and Cabot both north and east of the dome. Development Challenge Using a 25 mi2, Oryx, 1993 – 1994 vintage 3-D seismic survey, Cabot geoscientists identified several areas that appeared under-exploited. One area, located north of existing production, was characterized by apparent, multiple high-amplitude events on a low-relief structural closure that was separated from existing production by a subtle syncline. A second area – which is the focus of this paper – was located off the east flank of the producing feature in an area with no apparent trapping structure and no distinct stratigraphic separation from depleted producing zones. In both cases, conventional Dip Moveout (DMO) processing exhibited several high-amplitude events. However, the data was not suitable to define stratigraphic separation from existing production, nor to discriminate potential reservoir(s) or map their potential lateral extent. Due to reservoir depths and long producing history of the field complex, better tools were required to discriminate bypassed pay from residual gas in depleted reservoirs. Thus, to reduce the drilling risk of these prospects, Cabot embarked on a seismic reprocessing program that included pre-STM coupled with AVO processing of the Oryx 3-D data. Southeast Lake Pelto Prospect Cabot’s Southeast Lake Pelto Prospect was first identified via reconnaissance of the reprocessed, pre-STM 3-D dataset. A Class III AVO amplitude anomaly was seen basinward of previous production (Fig. 2) and was initially linked to the M-4 sand updip Sun S/L 2620 Wells 16 and 23. An immediate drainage-area problem arose due to an unexplainable excess of 27 Bcfg and 630 million bbl oil produced from the thin M-4 sand intervals in the two wells (14 ft gross pay at 15,790-ft MD in Well 17, and 30 ft gross pay at 15,698-ft MD in the Well 23). This produced area of the M-4 appeared to penetrate the amplitude anomaly.
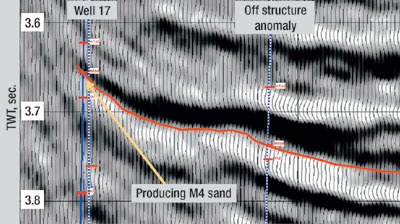
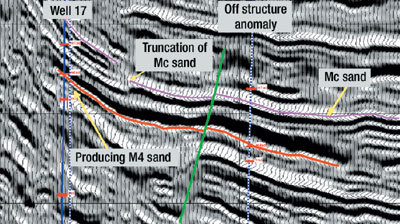
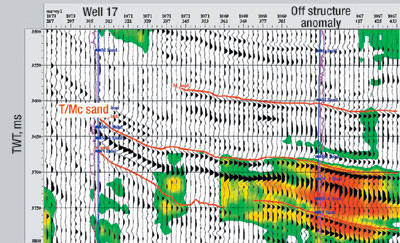
Additionally, seismic stratigraphy between the producing wells and the prospect area showed neither structural nor stratigraphic separation of the anomaly from the two producing wells. Images using DMO and pre-STM datasets also failed to show M-4 as a separate unit from the overlying Mc and M-1 sands. Even more troubling from drilling-risk perspective was the fact that, if a separate prospect existed downdip of the formerly productive wells, it had no apparent trapping mechanism. The production volume vs. drainage-area problem thus became an important consideration affecting any decision to exploit the anomaly. Prestack Kirchhoff time migration. It was decided early in the project to reprocess the 3-D seismic data to obtain a better image subsurface and look for Direct Hydrocarbon Indicators (DHIs). To focus deep reflectors, 3-D prestack Kirchhoff time migration was utilized. This process simultaneously solves for normal moveout, DMO and migration, placing reflectors in proper spatial positions while retaining as broad bandwidth as possible. High-frequency imaging. Since significant production in south Louisiana is often found in relatively thin sands and in stacked sand sequences, seismic resolution is a key to finding new pay. At 16,000 ft, about 3.7-sec. Two-Way Traveltime (TWT), most seismic data in the area is limited to about 40 to 50 Hz usable frequency. Using quarter-wavelength estimation, this means that the thinnest sandstone layer that can be fully resolved is about 65 – 80 ft thick. To maximize usable frequencies in the reprocessed seismic data, Geotrace’s proprietary High Frequency Imaging (HFI) was applied. This unique approach to whitening seismic data makes it possible to extract much higher frequencies than traditional methods. It is a widely known but seldom-used characteristic of seismic that the apparently narrow band trace contains higher-frequency information than an extracted wavelet would suggest. By recognizing that convolution is equivalent to polynomial multiplication, and polynomial division is its exact inverse, one can easily demonstrate this characteristic.3 A synthetic seismogram is constructed by convolving a spike series with a band-limited wavelet, the result being a band-limited trace containing, apparently, only those frequencies that were in the wavelet used. However, by employing polynomial division, the spike series can be obtained from the synthetic seismic trace. In other words, all of the original high-frequency information is contained in the low-frequency trace. Unfortunately, polynomial division cannot be used in the real world, because even the smallest amount of noise introduced into the trace makes the process unstable. HFI uses vector calculus, rather than polynomial mathematics, to solve the problem by viewing convolution as a vector rotation. The vector that represents the apparent low-frequency seismic is precisely determined, then rotated toward a white spectral position in the chosen vector space. The process is not sabotaged by ambient noise, and the resulting seismic is broadband with a higher signal-to-noise ratio. In this particular case, using the pre-STM data with 48 Hz maximum usable frequency at 3.7 sec. as input, the HFI yielded 110-Hz data on the high end, an increase of 129%. Now, beds as thin as 30 ft could be resolved in the zone of interest. This would prove to be extremely beneficial. Figs. 3 and 4 show a comparison of the normal-frequency pre-STM data and the HFI data on an arbitrary line from the 3-D survey. This line connects Well 17 to the prospect area anomaly. The HFI section more clearly images the continuity of the M-4 downdip of Well 17, which had been P&A’d after reservoir pressure depletion. Additionally, the Mc sand, which is wet and poorly developed in the updip Well 17, appears to be discontinuous between the two locations on the high-frequency data. It is also evident that a small fault separates the Mc sand seen in the updip wells from the downdip anomaly.
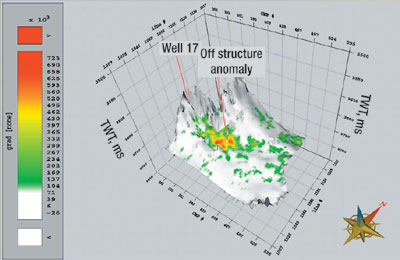
AVO. Since HFI was run on migrated CMP gathers, it was possible to calculate high-frequency AVO attributes on the seismic volume. Wells in the area were analyzed, and it was determined that producing sands fit into Class II or Class III AVO categories. That is, sands that contain gas or oil either had about the same impedance as surrounding shale or had lower impedance. In either case, the AVO effect on a resolved interface at the top of a producing sand is a high-amplitude trough at large angle of incidence. Both Intercept 3 Gradient and Intercept 3 Poisson’s Reflectivity attributes were useful, as they are good Class III and Class II tools, respectively. The Intercept 3 Gradient attribute exhibited a particularly good anomaly, the first DHI located downdip from Well 17. A horizon slice through this 3-D volume is shown in Fig. 5. As can be seen, there is no AVO anomaly at the same level in Well 17.
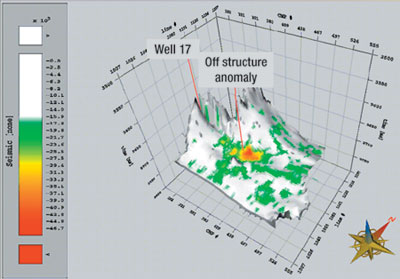
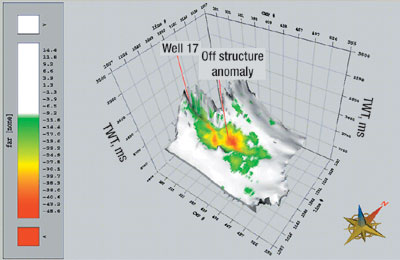
Frequency absorption. The broadband data was also scrutinized for absorption effects. As seismic energy passes through an absorptive layer, all frequencies are attenuated, but high frequencies are absorbed more quickly than low frequencies. Sands containing gas are good absorbers and, unlike many AVO effects, higher saturations produce better absorption anomalies. High-frequency seismic is preferable to narrow-band data, since absorption effects are much more apparent in the high end of the spectrum. A 3-D volume indicating degree of absorption was generated for the 25-mi2 3-D survey. An anomaly downdip from Well 17, the second DHI detected at that location, reinforced the AVO work done previously. A horizon slice through this 3-D volume is shown in Fig. 6. Notice that the anomaly does not extend updip to Well 17 well, which had been P&A’d before the 3-D survey was acquired. A vertical profile through this volume is shown in Fig. 7.
Based upon interpretation of the HFI-reprocessed data and the various AVO and Frequency Absorption Response (FAR) attributes, Cabot geoscientists came to the following conclusions:
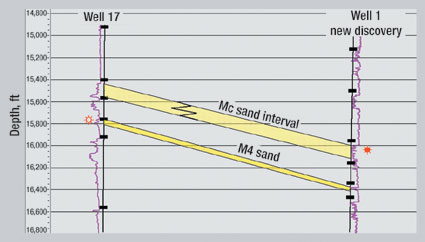
Drilling results. The Cabot S/L 16970 Well 1 was drilled to a 17,000-ft TD and completed as a producing gas well in the third quarter of 2001. Well log correlation and interpretation confirmed that the Mc sand had developed downdip of Wells 17 and 23, and the upper 50 ft of sand was clearly gas bearing. The M-1 sand was also present but not as well developed as in Well 17. A depleted M-4 sand was present and very similar in character to the M-4 sand in Well 17, Fig. 8. S/L 16970 Well 1 was put online on September 29, 2001, flowing at a rate of 4 MMcfgd. This rate has since been ramped up to more than 8 MMcfg and 500 bbl of 40° API-gravity oil per day.
Conclusions Interpretation of high-resolution seismic imaging, coupled with AVO-attribute analysis, provided the necessary means to interpret subtle changes in stratigraphy and structure that turned Cabot’s Southeast Lake Pelto prospect into a viable drilling opportunity. Using the high-frequency processing technique led to the conclusion that, although the Mc and M-1 sand intervals were correlative between the updip Wells 17 and 23 and the downdip prospect area, sand bodies within these intervals were nonetheless stratigraphically distinct units. Using HFI also permitted discriminating the M-4 sand from potential pay in the overlying Mc and M-1 sands. Strong stratigraphic trapping components of the reservoir were verified, as was existence of a very small fault – cutting up through the Mc/M-1 sand interval – that previously had not been recognized. AVO characteristics successfully predicted a gas accumulation, and FAR helped determine that the accumulation was, in fact, a virgin reservoir. Seismic interpretation using conventional frequencies would not have resulted in a drilling recommendation for this location, and substantial pay would have been bypassed. Acknowledgment The authors wish to thank Cabot Oil and Gas Corporation and Geotrace Technologies, Inc. for permission to publish this paper. We would additionally like to thank Ken Riddle of Cabot Oil and Dr. Truman Holcombe, Mike Jaffke and Russell Creath of Geotrace Technologies for their substantial contributions. WO Literature Cited 1 Waguespack, S. J., ed., Lake Pelto field, in Salt domes of south Louisiana, Vol. 3, New Orleans Geological Society, New Orleans, Louisiana, pp. 42 – 43, 1983. 2 Chacko, J. J., et al., MC-8. Upper Miocene sandstone – Louisiana Gulf Coast, Atlas of major central and eastern Gulf Coast gas reservoirs, Debout, D. G. et al, eds., Bureau of Economic Geology, Austin, Texas, pp. 11 – 13, 1992. 3 Stanford Exploration Project, http://sep.stanford.edu/public/docs/gem/ ajt/paper_html/node14.html
|
|||||||||||||||||||||||||||||||||


- Prices and governmental policies combine to stymie Canadian upstream growth (February 2024)
- U.S. producing gas wells increase despite low prices (February 2024)
- U.S. drilling: More of the same expected (February 2024)
- U.S. oil and natural gas production hits record highs (February 2024)
- Quantum computing and subsurface prediction (January 2024)
- U.S. upstream muddles along, with an eye toward 2024 (September 2023)
- Applying ultra-deep LWD resistivity technology successfully in a SAGD operation (May 2019)
- Adoption of wireless intelligent completions advances (May 2019)
- Majors double down as takeaway crunch eases (April 2019)
- What’s new in well logging and formation evaluation (April 2019)
- Qualification of a 20,000-psi subsea BOP: A collaborative approach (February 2019)
- ConocoPhillips’ Greg Leveille sees rapid trajectory of technical advancement continuing (February 2019)

