Technology at Work: New visualization system speeds E&P cycle for Murphy Oil
Feb. 2002 Vol. 223 No. 2 Feature Article TECHNOLOGY AT WORK New visualization system speeds E&P cycle for Murphy Oil Jeff Brum and Mark Hall, Fakes
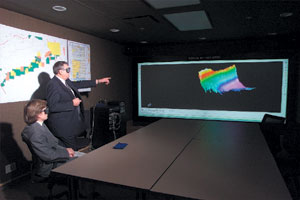
TECHNOLOGY AT WORKNew visualization system speeds E&P cycle for Murphy OilJeff Brum and Mark Hall, Fakespace Systems Inc., Kitchener, Ontario, Canada To compete successfully, oil and gas companies are looking for new ways to work efficiently with vast quantities of geophysical data. To maximize benefits of increased computing power and sophisticated software applications, many companies are implementing large, immersive visualization systems. These companies quickly learn that the systems promote teamwork and increase decision-making confidence. Canada’s Murphy Oil Co. Ltd., a division of Murphy Oil Corp., has a diverse asset portfolio that includes heavy-oil production, conventional oil and gas production, and working interests in the Syncrude Oil Sands project, Hibernia and Terra Nova projects, as well as extensive acreage offshore Nova Scotia. The company is a leader in implementing advanced-visualization technology. Murphy’s objective in installing a state-of-the-art visualization center at the company’s new Calgary exploration facility was to bring teams together in a comfortable, collaborative environment to facilitate communication between disciplines. They needed to view large 3-D datasets in real-time high resolution and hoped to gain more insight from their data by viewing it in new ways, as well as shorten E&P cycle time. To determine how to achieve these objectives, the company worked with high-performance, collaborative computing and display systems in several joint projects in facilities owned by partner companies. As a result of those experiences, Murphy Oil selected a stereoscopic Immersive WorkWall* from Fakespace Systems, driven by an SGI Onyx rack system. The system was the first super-bright, digital, immersive visualization system ever purchased for use in energy exploration. A collaborative environment. While Murphy Oil investigated monoscopic digital projectors, stereoscopic-capable projectors were chosen to help viewers better discern interpretation details contained within the data. The 6-ft by 16-ft WorkWall provides an extremely bright (5,000 lumens per projector) stereoscopic display that allows teams to work within subsurface simulations in a well-lit room, where they can also reference notes, printouts, drawings or other collaborative interaction tools – unlike previous dark-room systems.
The change from desktop monitors to large-scale visualization was met with enthusiasm. With traditional workstations, it is sometimes difficult to fully grasp the big picture. In addition to gaining a broader understanding of the data, there is the opportunity to share ideas with more team members. The rear-projected, high-resolution display enables the exploration team to gather close to the screen for discussion and inspection of minute details within these massive visualizations. One of the biggest advantages of the system is that it enables development teams to see how a well is plotted in a 3-D geological section. Stereoscopic viewing also allows the users to quickly determine spatial relationships and dependencies between complex structures. The images were so engaging that exploration team members immediately started approaching the screen to point to virtual formations and other data. Murphy Oil eventually had to install a barrier in front of the display surface to prevent users from directly touching the screen. For Murphy Oil’s offshore exploration, focused primarily off Canada’s eastern coast, the graphic-rendering power of the SGI supercomputer provides real-time rendering of highly complex 3-D deepwater data. Terry McCoy, vice president of Exploration and Land, said that the company has found tremendous value in the system. "You should not expect to have ‘a eureka event.’ Right now, we are realizing gains simply from getting our technical teams together in one room with lots of data available for review on the big screens, resulting in a technically better, more integrated interpretation," said McCoy. Duncan McMaster, general manager of East Coast Exploration, reports that using the new system has shortened exploration cycles by 50 – 60%, and he expects the speed to increase as the company gains experience using the immersive environment. According to McMaster, speeding seismic data analysis is crucial to Murphy Oil’s bottom line. "We’ve been doing some work on the East Coast where we’ve been shooting surveys with data volumes as large as 11 GB," he said. "Our new visualization center lets us load up this quantity of data and do some quick interpretation that allowed us to focus on the area within five days. If we had done that in a conventional manner, it would have taken at least a month’s work." Murphy Oil is still learning about the benefits of large-scale visualization, but McMaster is quite clear about its initial value. "Geologists and geophysicists are used to thinking in 3-D, but I don’t think engineers are," said McMaster. "When engineers can actually see how a well is plotted in a 3-D geological section and can see how faults and surfaces influence the well trajectory, I think they start to understand some of the problems they could encounter. We’ve seen cases where a decision that may look straightforward when illustrated on paper proves to be a mistake when viewed in 3-D. It’s a huge advantage to have this kind of visualization," he said.
|
||||||||||||||||||||||
- Prices and governmental policies combine to stymie Canadian upstream growth (February 2024)
- U.S. producing gas wells increase despite low prices (February 2024)
- U.S. drilling: More of the same expected (February 2024)
- U.S. oil and natural gas production hits record highs (February 2024)
- Quantum computing and subsurface prediction (January 2024)
- U.S. upstream muddles along, with an eye toward 2024 (September 2023)

