Natural Gas: North American Outlook
NATURAL GAS:
|
|||||||||||||||||||||||||||||||||||||||||||||||||||||||||||||||||||||||||||||||||||||||||||||||||||||||||||||||||
 |
|
|
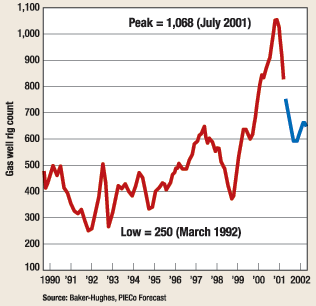
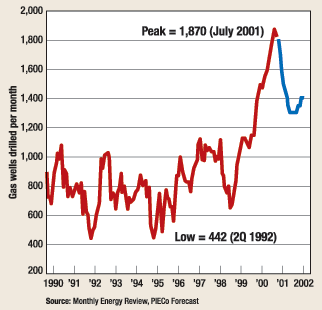
Total gas-well drilling in 2001 is estimated to have equaled or slightly exceeded the previous high number of gas wells drilled in one year – 20,166, back in 1981. Development drilling in 2001 set a new record, estimated at 19,000 wells. However, the exploratory-well count, while up year-over-year, was well below anything resembling a record-breaking rate.
The outlook for gas-well drilling in 2002 is for a retreat from the 2001 level to about 15,000, but still ahead of the number of gas wells drilled in the intervening years, as reported by EIA in its Monthly Energy Review.
Production / reserves. Table 1 data, taken from the DOE Annual Reserves Report, lists Lower-48, year-end 2000 proved dry-gas reserves to be 168 Tcf, up by about 10 Tcf from the previous year. We estimate that proved reserves at year-end 2001 are on the order of 180 Tcf, the highest level since the mid-80s, largely as a result of record levels of gas-well drilling in 2000 – 2001, Fig. 2. The tight supply concerns of a year ago have vanished for the time being.
|
||||||||||||||||||||||||||||||||||||||||||||||||||||||||||||
 |
|
|
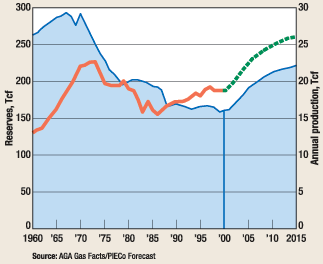
Reliable sources predict that U.S. gas production will rise to about 26 Tcf /yr by 2015, Fig. 3, making a 30-Tcf/yr market. To support this kind of market will require a dry-gas reserve base of about 220 Tcf. Slicing it another way, we will have to discover about 450 Tcf of new reserves between now and then, more than double the rate for the last 10 years – not exactly a piece of cake.
 |
|
|
U.S. production increased by about 1.7% in 2001 to 19.3 Tcf. The outlook for 2002 is for production to stay about even. The shallow waters of the Gulf of Mexico will most likely attract exploration companies seeking to get a piece of the action in the growing Eastern-U.S. gas market. Onshore will be the scene of modest increases in drilling, with coalbed methane taking an ever-larger piece of the action.
The rate of depletion of high-deliverability reserves is an issue with regard to the potential for deliverability shortfall. Low-deliverability, tight-gas reserves do not bring as much to the table as high-deliverability reserves in the Gulf of Mexico. According to the Natural Gas Supply Association (NGSA), offshore GOM reserves are being depleted at rates approaching 50% during the first year onstream. That puts pipeline operators between a rock and a hard place with regard to the cost of building short-lived pipelines and expensive gathering facilities. In other locations, production rates are usually quite a bit less. Also, older existing reservoirs are likely to be well down on their respective deliverability curves.
Reserve additions in the gas-prone areas of the Gulf of Mexico are crucial to maintaining deliverability to Eastern markets. It is imperative that GOM exploration accelerates to assure stability of the gas market in the Eastern U.S. However, that is not what’s happening. At last count, there were only 129 rigs working in the Gulf, down from a high of 192 last May.
The problem is gas prices. Jackup utilization cannot be sustained in the present gas-price environment. Jackup utilization now stands at about 65%. The overall Gulf of Mexico rig utilization is under 65%, and dayrates are down accordingly. That is fine for operators coping with depressed gas prices, but tough on drilling companies.
Reserve life index. For the Lower-48, the Reserve Life Index (RLI) at year-end 2001 is estimated to be 9.4, a significant improvement from recent experience. The RLI serves as an indicator of deliverability. A low RLI, i.e., less than 8.0, would suggest tight supply – 9.0 or better would restore a measure of comfort level. The U.S. RLI has been in decline for many years, and it was not until year-end 2001 that it climbed back above 9.0. Given the impact of the huge increase in the number of wells drilled in 2001, and the likelihood that 2002 will also be a good year for completions, the RLI will probably remain above 9.0 at least until 2003.
North Slope reserves, about 16 Tcf, were dropped off the radar screen years ago due to the belief that projected costs of building pipeline(s) from the North Slope to the Lower-48 were prohibitive. However, the price spike of last winter, together with improved construction economics, has brought North Slope and McKenzie Delta gas back into the picture, likely in the 2006 – 2010 time frame. We’re looking at 2 – 3 Bcfd gas coming down from the North Slope.
Coalbed methane. A silver lining to otherwise dark clouds is the buildup in coalbed methane (CBM) reserves and production, Table 2. CBM production increased at a phenomenal rate early in the 1990s, to 100%/yr from 50%/yr. While the rate of increase has moderated, production growth continues in the 5 – 10%/yr range.
|
|||||||||||||||||||||||||||||||||||
Year-end-2001 CBM reserves are estimated to have passed the 16-Tcf mark, accounting for nearly 10% of all domestic reserves. Production in 2001 is estimated to be in excess of 1.5 Tcf. The outlook for 2002 is for CBM reserves to increase to over 17 Tcf, and yearly production to exceed 1.6 Tcf. About 83% of CBM reserves are located in the Rocky Mountain states of Colorado, New Mexico, Utah and Wyoming.
Imports. Natural gas imports reached an estimated 4.1 Tcf in 2001, up about 7.3%, mostly from Canada. Look for more gas to come across the border as pipelines achieve higher load factors, with gas from the Western Canada Sedimentary basin and Nova Scotia. LNG is cast to take on a larger role in supplementing domestic production. Some 20 or so LNG projects have been announced for over the next five to six years, which, if all come to pass, would add about 9 Bcfd to the gas supply mix. At an 85% load factor, that amounts to about 2.8 Tcf/yr.
U.S. Demand, Other Factors
Gas demand, down in 2001 despite colder-than-normal weather last winter, is expected to pick up due to a big lift later this year from industrial users in a recovering economy. This latter factor, with some improvement in the electric utility market, will more than offset a modest downturn in residential and commercial consumption based on an expectation of normal weather.
However, a long-term reality check is in order. The conventional wisdom holds that gas demand will pass the 30 Tcf mark by 2015. With a downturn in the economy, look for power-plant operators to back away from huge capital outlays in project-financed growth in the generation business. One fallback position is to rethink the option of refurbishing old plants. Another is to step up the construction of distributed-generation projects requiring smaller capital outlays.
As a result, there could well be fewer relatively-high-efficiency combined cycle gas turbine generating stations coming online over the next few years than previously expected. The issue cuts both ways in terms of gas consumption; refurbishing old coal-fired steam plants or extending the life of nuclear plants means a loss of market for gas, period. Players caught in a capital squeeze will do what they have to do.
Storage. After taking gas storage to the brink of shortfall during the withdrawal season in early 2001, the players were able to turn the situation completely around, rebuilding storage to a new high. As it stands, there are record levels of natural gas in storage, as far as the eye can see. The buildup in storage was made possible by shrinking demand. Putting that together with a warmer-than-normal winter to this point does not bode well for prices.
Pipelines. Energy and Environmental Analysis, a knowledgeable consulting firm operating out of Arlington, Virginia, recently reported to the INGAA Foundation that, by 2015, some 43,000 mi of pipeline additions will be required to satisfy an expanding market. The buildup will be heavier in the early years as the pipeline network connects with more frontier supply sources. Later capacity expansions will likely be more horsepower additions.
Security. We still do not know how national security issues will play out over the natural gas infrastructure. Devising a workable plan that will give us some comfort for the integrity of our system – which includes many thousands of gas wells, hundreds of thousands of miles of gathering systems and pipelines and thousands of compressor station and meter station sites, not to mention existing / proposed LNG facilities – is a task that boggles the mind, let alone puts a heavy hit on the pocketbook. As one operator said, "It’s a matter of perception," as to what security means.
The FERC has said that operators can pass security costs through to capacity users – more easily said than done. But we can be reasonably assured that owners and operators will be scrambling to come up with workable solutions.
In the meantime, the House has introduced pipeline safety legislation entitled the "Pipeline Infrastructure Protection to Enhance Security and Safety Act." (An acronym for this one will be tough). It is expected that the Congress will pass pipeline safety legislation early this year – it remains to be seen as to how far the legislation will go in terms of security.
Canada
Annual natural gas production is slightly more than 6 Tcf. Exports from Canada to the U.S. in 2001 are estimated to be about 3.8 Tcf, and are expected to climb past the 4-Tcf mark in 2002. Exports account for about two-thirds of annual production. Although drilling has increased, deliverability has increased only marginally. To sustain deliverability, production from new wells has to be equivalent to 20% of current production, a tall order.
According to the Canadian Gas Potential Committee (CGPC), the Western Canada Sedimentary basin (WCSB) continues as the location of the majority of conventional gas supply in Canada, currently estimated to be about 142 Tcf. All told, including Nova Scotia and the Northwest Territory, Canada’s "nominal" remaining marketable gas reserves add up to about 190 Tcf. Going a step farther to include reserves in remote frontier areas, the total rises to about 233 Tcf. Going yet another step, the volume of unconventional gas resources in-place is estimated to be quite substantial, including resources such as coalbed methane, hydrates, tight gas and shale gas. However, development of these resources will require substantial capital expenditures and extensive drilling programs.
Mexico
Pemex’s gas production is slipping, at the same time that demand is expanding. In 1999, Mexico only drilled 20 – 30 wells. It is estimated that, by 2010, it will need to drill 500 – 700 wells per year to keep pace with demand. The country is relatively rich in gas reserves, with most located in Northeast Mexico’s Burgos basin. Major political issues must be dealt with before much can be done to achieve the needed acceleration of gas production.
Summary
How did we get to this point? In the early 1970s, U.S. gas consumption peaked at 22.6 Tcf, at about the time of the first "oil crisis." The production decline that began in 1973 continued on for 10 years until 1983, before bottoming out at 15.8 Tcf. Some of that market was lost forever. But not much was happening, and by the late 1970s, we were in a supply bind to the extent that market priorities were promulgated to, in essence, "ration" gas supply. The Natural Gas Policy Act of 1978 included incentives designed to stimulate production. They worked, well enough to create a surplus which we called a "gas bubble."
To alleviate problems associated with the so-called bubble, the FERC devised initiatives aimed at encouraging competition that completely revamped the gas business, opening it up to the point where buyers have free access to producers and marketers in a real-time market, pretty much keyed to the futures market, epitomized by the NYMEX screen. Operating under this scenario gives players on the NYMEX the ability to bring about gas price volatility, the likes of which we’ve never seen before.
Meanwhile, working at the front edge of the gas business, we have learned that we can drill more wells than ever before, and we believe we can produce and deliver more gas per year than ever before. We are confident that the gas resource base is big enough.
Bringing it all down to the bottom line, the challenge is breathtaking. All it takes is time and money. ![]()
The author |
|
 |
Leonard V. Parent, a World Oil contributing editor, holds a BS in chemical engineering from Purdue University, and has been active in the gas business since 1950, beginning with Natural Gas Pipeline Co. of America. He later joined Trunkline Gas Co. in Houston and, in 1968, was appointed to corporate planning for Panhandle Eastern. Mr. Parent took early retirement after 26 years with Panhandle and Trunkline, and embarked on a second career as a consultant and publisher of The Gas Price Report and The Gas Price Index. |
- Prices and governmental policies combine to stymie Canadian upstream growth (February 2024)
- U.S. producing gas wells increase despite low prices (February 2024)
- U.S. drilling: More of the same expected (February 2024)
- U.S. oil and natural gas production hits record highs (February 2024)
- U.S. upstream muddles along, with an eye toward 2024 (September 2023)
- Canada's upstream soldiers on despite governmental interference (September 2023)


