Software program offers predictive capability to optimize drilling
DRILLINGSoftware program offers predictive capability to optimize drillingNew drilling mechanics software model has been proven in test wells and actual drilling of the target formation and hard, cemented limestone stringers in the North Sea’s Oseberg fieldJack Pruitt, W. A. Goldman and Eric Claudey, Halliburton Energy Services
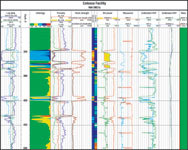
Introduction In an effort to optimize drilling performance, a computerized drilling analysis program was developed by Halliburton Security DBS that has the ability to combine advanced drilling mechanics with rock-strength analysis. The new proprietary GeoMechanics Drilling System software program uses a rock-strength model that has long been recognized as a value-added service for customers seeking information on the lithology to be drilled. With implementation of the drilling mechanics model, the software program moves from a passive information tool to a predictive tool for optimizing drilling performance. Utilizing calculated rock strength and a 3-D model which is unique for each bit, the drilling mechanics program recommends optimum drilling parameters, namely weight-on-bit (WOB) and bit revolutions per minute (RPM), for a set of operating constraints. Given sufficient data from offset wells to perform a rock-strength analysis and knowledge of the rig constraints for a specific well, the software can be used to optimize drilling parameters and predict resulting performance, as measured by ROP, for a specified drill bit program. To date, successful optimization jobs have been conducted for several major international operators. One of those, Norsk Hydro, saw a performance improvement of more than 50% through a critical hole interval in one recently drilled North Sea well. Rock Mechanics: The Foundation Within the analysis system, the rock-strength model provides the foundation for all drilling mechanics models through use of its unique, patented concepts for defining rock strength.1 – 7 Lithology-specific, the model individually calculates the strengths of each component, differentiating between confined, unconfined and tensile conditions. Effects of overbalance, underbalance and permeability are also accounted for, while overburden effects are factored into the porosity correlation. This level of sophistication is, in part, the result of using actual triaxial rock-strength measurements from cores obtained around the world. The net result of this extensive research is a rock-strength model with globally applicable, lithology-specific correlations. In addition, with sufficient data for the lithologies of interest, the global correlations can be optimized for a particular basin using input from any log suite sensitive to lithology and porosity.8 Drilling Mechanics: A Model of Optimization While the rock strength models provide the geologic foundation for the well to be drilled, the drilling mechanics models can reflect how efficient a given bit and drilling rig are in drilling. Previous bit optimization programs were based on subjective analyses supplied by bit records and dull-bit analysis. The drilling-mechanics model scientifically analyzes the drilling parameters and the bit design for a planned drilling interval with forecast, specific rock strength. The new model provides a quantitative estimate of improved performance for any changes made in bit design or in actual parameters to be applied. The software is also able to calculate the mechanical efficiency of any bit type in any rock strength at any wear condition. The capability to calculate mechanical efficiency is possible because a 3-D bit model is utilized that can generate the unique Torque-WOB signature for a specific bit design. Within drilling mechanics, the mechanical-efficiency model provides the causal link between a specific bit design and its predicted drilling performance. The model determines certain parameters that are then used by other drilling mechanics models to predict, optimize and analyze drilling performance. For example, the mechanical efficiency model can determine total bit force, which is used by the bit wear model to determine cumulative work done. As shown on the sample output from GRI’s Catoosa, Oklahoma, site tests, the GeoMechanics drilling simulator compares actual performance against predictions, Fig. 1. In this sample, rock strength (Track 5) is calculated from the log data (Track 1). A predicted ROP is modeled from actual WOB/RPM parameters for calculated rock strength. In Track 10, instantaneous ROPs (predicted and actual) are compared to give an indication of the trend match. Overall average ROPs for the run are compared in Track 11 to measure cumulative accuracy of the model. As shown, there is good accuracy for the overall run, as well as good trending of predicted ROP with actual ROP.
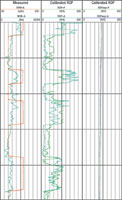
Initial Field Testing: History Matching To prove the drilling mechanics model, data was gathered from several wells to compare actual performance with predictions. Typically, WOB, RPM and ROP were provided in digital format. Rock strength was calculated from the log data. Actual drilling parameters were utilized to create an ROP prediction for the calculated rock strength. The "predicted" ROP was compared to actual ROP in two forms: 1) instantaneous ROPs were compared to indicate the trend match; and 2) overall average ROPs for the run were compared to measure cumulative accuracy for the total run. Fig. 2 depicts this type of analysis, with actual WOB and RPM in the first track, instantaneous predicted / actual ROP in Track 2, and cumulative predicted / actual ROP in Track 3. This interval is particularly interesting, as it shows the effect of alternating oriented and rotated sections in a directional well. Oriented sections show about 90 rpm vs. rotated intervals of 160 – 165 rpm.
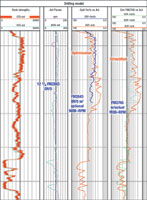
In comparing actual vs. predicted ROPs, it was sometimes necessary to "calibrate" the parameters for the particular rig / field. As long as the trend comparison was good, the process of calibration was deemed satisfactory – as was the case in about 80% of the runs tested. In runs where the trend comparison was not good, hydraulics emerged as the key issue. Notably in soft formations, the hydraulic washing effect often accelerated ROP beyond that predicted by the model. This explanation makes sense, as the model is based on mechanical principles with no allowance for hydraulic enhancement. In addition, actual performance lagged predictions in highly plastic shales. Here, sluggish performance was attributed to the inability to sufficiently clean the hole to achieve the mechanical efficiency predicted by the model. To determine validity of the calibration process, back-to-back runs of identical bits in the same well were sought. If the first run was calibrated and provided a good match on the subsequent run, without adjusting the parameters, then the calibration process would be deemed valid. As it developed, obtaining back-to-back runs was more difficult than expected. Only one well in the test group had back-to-back runs with the same bit design. Nevertheless, results on this one test offered an excellent match via the calibration process. To further simulate the process in other runs, a history match was performed in the first portion of a run and compared to the calibrated parameter prediction in the latter portion. Again, excellent matches were achieved. The next step was to utilize the model to optimize the drilling process. Optimization is best employed in a multi-well program where the history-match process can be used to calibrate the model. The calibrated parameters can be applied on subsequent planned wells. The first step in optimization would be to make a run using calibrated parameters applied to the anticipated rock strength column while considering the given rig constraints. This will indicate improvement that can be expected from the same bit program when optimizing drilling parameters only. In some cases, this may be all that is required for the well program. Other cases, such as the one described below, may require changing the bit design or selection, and performing an optimization run to compare predicted performance against the previous bit design. Case History: Operator Sees 50% Improvement In the Norwegian sector of the North Sea, Norsk Hydro saw significant performance improvement with use of a new PDC bit design that was developed based on the GeoMechanics Drilling System. A study of a sidetrack through a hard, cemented limestone section into the Shetland formation of an Oseberg South well indicated improvements were possible. As a result, a new 12-1/4-in. FM2765 bit was designed, in particular to overcome low ROP in this formation. The resulting FM2765 DR/5RS design is an evolution of the previous FM2843 DR/5RS, which showed good direction capabilities on Oseberg field wells. Due to the high steering requirement, a short-gauge bit was recommended for use with a rotary-steerable device. The drilling-mechanics model was run on a previous section drilled with the FM2843, and also with a competitive bit. Comparison provided a good history match, with the model predicting an ROP just 5% – 10% below actual ROP. Fig. 3 shows two separate predictions done for the planned well. The channel labeled optimization modeled ROP using an FM2843 bit – as had been used to drill the offset well – and also using optimized values for RPM and WOB. The simulation channel provides an ROP forecast using the new FM2765 with the actual RPM and WOB parameters from the offset. In both of these channels, the actual offset ROP is also shown for comparison.
Based on the penetration rate achieved on offset wells and on the GeoMechanics program model, the new 7-bladed bit design with 19-mm, proprietary Deep Ring Claw* cutters was selected to improve penetration rate in the Shetland formation. Drilling mechanics were then run with the FM2765 design, showing a potential improvement in ROP through the hard, cemented limestone that had caused slow drilling. The model then optimized WOB and RPM to penetrate the hard stringers at maximum ROP without sacrificing PDC life. Based on these simulations, the new design was presented to the operator, and drilling parameters were recommended. The FM2765 was run and went to TD according to plan. The bit was pulled and dull graded 1-1 as predicted. Overall penetration rate was improved to 18 m/hr, from 12 m/hr in the Shetland formation. Total improvement included an ROP increase in the limestone to 8.5 m/hr from less than 7 m/hr. ROP improvement was due to improved bit design and optimization of the drilling parameters (RPM was decreased by 35%, while WOB was held constant). The two well paths were slightly different. The FM2765 entered the Shetland formation at 45° inclination and built to 65°. The offset well held inclination constant at about 73°. Based on this success, a new study is underway to match, in future wells, the performance achieved. In addition, an effort is underway to refine the theoretical drilling mechanics model. Conclusions A rock-mechanics model has been advanced to help forecast drilling performance. The model was verified by comparing performance on historical wells in the database to the prediction. And field testing of the optimization program proved the model a success. The model now can be used to optimize RPM and WOB parameters for an existing program, or to compare current performance against performance resulting from any new bit program. Best use of the model is in multi-well projects where it can be calibrated to the particular field, with its particular formation characteristics and rig – the latter with its own capabilities to control ROP and WOB. Acknowledgment The authors express thanks to Frode Nygaard and Geir Skofteby of Norsk Hodro for their assistance in presenting this case history. Literature Cited 1 U.S. Pat. 5,794,720 (8/18/98) Method of assaying downhole occurrences and conditions. 2 U.S. Pat. 5,704,436 (1/16/98) Method of regulating drilling conditions applied to a well bit. 3 U.S. Pat. 5,767,399 (6/16/98) Method of assaying compressive strength of rock. 4 U.S. Pat. 6,044,327 (3/28/00) Method for quantifying the lithologic composition of formations surrounding earth bore holes. 5 U.S. Pat. 6,131,673 (10/17/00) Method of assaying downhole occurrences and conditions. 6 U.S. 6 Pat. 6,052,649 (4/18/00) Method and apparatus for quantifying shale plasticity from well logs. 7 U.S. Pat. 6,109,368 (8/29/00) Method and system for predicting performance of a drilling system for a given formation. 8 Onyia, C.R., paper SPE 18166, Amoco Research, 1988.
|
|||||||||||||||||||||||||||||


- Coiled tubing drilling’s role in the energy transition (March 2024)
- Using data to create new completion efficiencies (February 2024)
- Digital tool kit enhances real-time decision-making to improve drilling efficiency and performance (February 2024)
- E&P outside the U.S. maintains a disciplined pace (February 2024)
- U.S. operators reduce activity as crude prices plunge (February 2024)
- Drilling advances (January 2024)
- Applying ultra-deep LWD resistivity technology successfully in a SAGD operation (May 2019)
- Adoption of wireless intelligent completions advances (May 2019)
- Majors double down as takeaway crunch eases (April 2019)
- What’s new in well logging and formation evaluation (April 2019)
- Qualification of a 20,000-psi subsea BOP: A collaborative approach (February 2019)
- ConocoPhillips’ Greg Leveille sees rapid trajectory of technical advancement continuing (February 2019)

