Hydraulic thrusting devices improve drilling efficiencies
DRILLINGHydraulic thrusting devices improve drilling efficienciesImproved penetration rates and reduced downhole tool failures resulted from using hydraulic thrusters in medium-to-high-angle applicationsCorles A. Giles and Tony Seesahai, BP; John W. Brooks, Smith International Inc.; and Wilmark Johnatty, Trinpet Services
Thrusting devices were first used in BP-Trinidad’s drilling operations with the start-up of the Mahogany A development offshore in January 1998. Subsequently, thrusting devices were used on the Immortelle Phase 4 development project offshore Trinidad. Their use became widespread on these projects and continued to be used in the development of the Mahogany B project. Background Prior to the application of thrusting devices, much difficulty was experienced in meeting the objective of drilling the 12-1/4-in. hole section to casing point in one PDC bit run using water based drilling fluid. Before thrusting devices were used, the 12-1/4-in. hole objective had only been achieved once in the history of these projects. The normal well profile is for the 12-1/4-in. hole section to start vertically at about 4,000 ft, and kickoff between 4,000 and 6,000 ft. Hole angle is then built to 25° to 70° and held tangentially, or built to 90° for an 8-1/2-in. hole, horizontal well. The difficulties encountered included weight-stacking, stick slip, excessive downhole torque, frequent motor stalling and poor sliding performance. Thrusting devices were considered initially for two primary reasons – to improve rate-of-penetration (ROP) and to reduce downhole tool failure (DTF). Drilling performance issues that were to be addressed by using thrusting devices included:
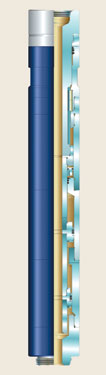
Thrusting Device Principles The established benefit of thrusting devices is the improvement of drilling performance by applying consistent weight-on-bit (WOB). Another benefit is a reduction in the common problems and equipment damages associated with high-shock loading often seen in high-angle wells. In most cases, the tool should improve ROP, extend bit life and extend the life of other components run in the bottomhole assembly. A thrusting device (Fig. 1) acts like a hydraulic piston pushing downward when placed properly in the BHA. This axial force, both up and down, is created by the differential pressure losses of the bit nozzles and other bottomhole assembly components below the tool. The magnitude of the force produced by the tool is also a function of the fluid mandrel area (piston area) of the tool.
The fluid mandrel piston area of the thrusting device is variable depending on the tool size, and it will accommodate a wide range of drilling (or milling) applications. The axial motion from the bit is isolated from the rest of the drillstring, which prevents further build-up of axial vibrations. The result is constant WOB and a reduction in the shock loading created by bit bounce. Tool face control, weight-stacking, and mud motor stalling problems normally associated with high-angle wells also will be minimized with the use of a thrusting device. Study Objectives This study has two primary areas of focus. The first is the evaluation of drilling performance and penetration rates, hereafter referred to as the ROP Study, and the other is the evaluation of downhole tool failures, hereafter referred to as the DTF Study. Results show that thrusting devices impact favorably on these and other drilling environments. The study’s purpose was to quantify the impact thrusting devices had on drilling operations from three BP-Trinidad development platforms. Thrusting devices were adopted to improve sliding in difficult mechanical conditions, and to help lower downhole tool (MWD, LWD, PDM and other BHA-component) failure rates. After the first 12 months of using thrusting devices on two rigs, there was a need to document their results. Thus, a study was commissioned by BP-Trinidad (formerly Amoco Trinidad Oil Co.) in December 1998, to determine the benefits of thrusting devices. The study was performed over a three-year period, covering most of the wells drilled from three platforms. Eighty-five BHAs (162,000 ft drilled) were studied. It was determined that statistical errors and other anomalies that could skew conclusions would have minimal impact due to the extensive data population. Data and Evaluation Methods Data were accumulated from BP’s wells drilled offshore Trinidad between November 1997 and March 1999. All were deviated, ranging from 16° to 90°. Well types varied from gas completions to horizontal completions into oil reservoirs. The evaluation is ongoing for BP-Trinidad’s development projects, and has continued into the more recent Amherstia development project. General aspects of the data population are shown in Table 1. Note that data were collected from the 12-1/4-in. and 8-1/2-in. hole sections only. Table 2 shows the scope of the data in terms of volume collected for the three platforms.
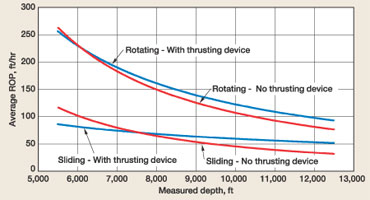
The core of the ROP Study was based on mud logging ASCII data. Foot-by-foot penetration rates were averaged by sliding and rotating criteria. The data were averaged over various intervals for each BHA run and plotted as ROP vs. measured depth (MD), similar to that shown in Fig. 2. When processing the ASCII data, torque or RPM was used as a discriminant to determine whether the BHA was being rotated or slid. This data was averaged over 5-, 20- and 100-ft intervals, and averaged for the entire BHA run footage.
In almost every case, the relationship between ROP vs. depth tended to follow a power-law type of decay, which could be represented by:
Where k and n (decay factor) are power-law constants for a given set of conditions. Obviously, this relationship could be better determined by using true vertical depth (TVD) and correcting for geological factors. This relationship should be expected, since typically, formations become more difficult to drill, and mechanical complications that reduce penetration rates mount as the borehole deepens. Eventually, at certain depths, the difficulties associated with drilling deeper will affect all drilling parameters and approach some limit for these parameters. The rate of decay of penetration rate shown in graphs generated (similar to Fig. 2) could be used to measure the loss of mechanical efficiency and natural inability to drill formations with depth. In addition to the ASCII drilling data, bit and BHA run summaries were evaluated (from the daily drilling reports and directional drilling reports). Overall run ROPs (total footage divided by total on-bottom hours) were compared with the foot-by-foot ASCII data. Sliding and rotating ROPs recorded in the directional drilling reports also were compared with the electronic data. Sometimes, there was ambiguity as to when an MWD or motor failure occurred. In some instances, a trip was made for lack of MWD data, and later, the run may not have been classified as an MWD failure. (Refer to AADE paper 01-NC-HO-34 for clarification of failure modes.) Thrusting Devices and ROPs For the ROP Study, it was decided to use ROP vs. depth curves similar to those in Fig. 2. Several of these were generated using data for differing conditions, such as different mud or bit types. In most cases (using Microsoft Excel’s plotting function), the curves representing BHAs, which included a thrusting device, showed higher ROP trends (similar to Fig. 2). To evaluate ROP performance, the four scenarios shown in Table 3 were evaluated for varying intervals. Note that there are two pairs of curves in Fig. 2 – the sliding pair, with and without the thrusting device, and the rotating pair, with and without thrusting device. For large data populations, long intervals were averaged. These intervals were 500 to 1,000 ft long and plotted, as in Fig. 2, with ROP versus measured depth. These data were sorted and separated according to BHA run and hole size. During the study, factors like mud types, bit types, hole angle and other factors that influence ROP were considered and plotted for the given scenarios. Where sufficient data points were available, the plots showed trends similar to those in Fig. 2.
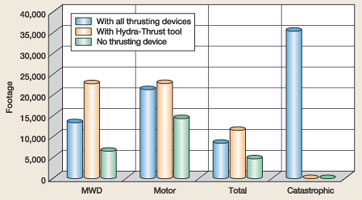
For purposes of this article, and to be as comprehensive as possible, all data collected were used to generate the composite chart shown in Fig. 2. Data were averaged according to a maximum of 1,000-ft intervals and truncated by the BHA run. Since the data population was quite large (data associated with 162,000 ft of drilled hole), one can be reasonably confident in drawing conclusions, since spurious data, which could skew the results, will be averaged into the large population. The curves of Fig. 2 show that beyond 6,000 to 7,000 ft, separation starts to develop between the two pairs of curves, with separation increasing with depth. This separation implies improved penetration rates where the thrusting device was used. This response was expected as the thrusting device is placed and optimized to respond to parameters and conditions at about 8,000 to 10,000 ft. This is where problems are normally experienced, i.e. getting constant WOB and other factors that affect the application. One observation that was not anticipated was the generally improved response in the "all rotary" drilling mode. ROP showed improvement in the rotary mode, although not as significant when compared to the all-sliding mode data. The data showed that at 10,000 ft, penetration rates were about 35% and 15% higher with thrusting device BHAs for sliding and rotating, respectively. An analysis was done based on percentage of sliding, typical of the intervals from 6,000 to 11,000 ft, and based on the ROP averages for the wells under consideration. Tool Failure Rates Tool failure data was collected from MWD and directional drilling final well reports. Daily drilling reports and other data sources were used to qualify this information. Initially, industry standard mean-time-between-failure (MTBF) ratings were used to compare the different failure scenarios. In addition to MWD failures, motor and catastrophic failures were studied. They were examined in three BHA scenarios as outlined below, and are summarized in Table 4.
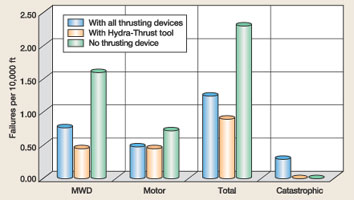
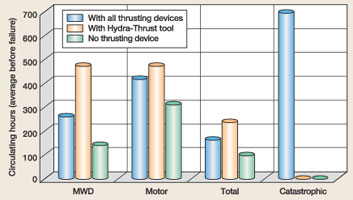
Again, as with the ROP Study, the DTF Study ignored runs in which no drilling took place, regardless of whether a failure occurred or thrusting device was run. The failure comparisons are illustrated in Figs. 3 – 5. These charts normalize failures according to circulating hours, footage drilled or runs. It should be emphasized that the drilling conditions, equipment used, MWD/PDM types and geological conditions for all these projects are quite similar.
These data are plotted in the following categories:
The three BHA scenarios considered were:
The cost savings in situations where MWD failures have a significant impact on well costs could be the most significant benefit of using thrusting devices. In most of the MWD/PDM failures in the study, a failure almost always required a round trip, which meant at least 15 hr of lost rig time. For these projects, the associated cost is about $100,000 for a round trip. Conclusions This study looked at 85 BHA runs where medium-to-high-angle holes were drilled. Two areas of interest were researched – performance drilling based on penetration rates and downhole tool failure rates. The study found that considerable cost savings could be attributable to a properly placed thrusting device in the BHAs of medium-to-high-angle applications. These savings were in two separate areas:
Acknowledgment The authors thank the management of BP, Smith International Inc. and Trinpet for permission to publish this article. The authors also thank William Schofield (BP), Jonathan Perry (BP), Maria Boyd (BP), Allan Contant (Trinpet), Glenn Martin (Smith International Inc.) and George McKown (Smith International Inc.) for their contributions. This was adapted from the AADE 2001 National Drilling Conference (Houston, Texas, March 27 – 29, 2001) paper, "Drilling efficiencies provided by hydraulic thrusting devices." Bibliography Reich, M.; P. G. Hoving, and F. Makohl, "Drilling performance improvements using downhole thrusters," SPE/IADC paper 29420, SPE/IADC Drilling Conference, Amsterdam, The Netherlands, Feb. 28 – March 2, 1995. Geldof, W.; E. Merrall, D. Kent, and M. Dautel, "World record horizontal bit runs in Oman," SPE/IADC paper 57536, SPE/IADC Middle East Drilling Technology Conference, Abu Dhabi, UAE, Nov. 8 – 10, 1999.
|
|||||||||||||||||||||||||||||||||||||||||||||||||||||||||||||||||||||||||||||||||||||||||||||||||||||||||||||||||||||||||||||||||||||||||||||||||||||||||||||||||||||||||||||||||||||||||||||||||||||||||||||||||||||||||||||||||||||||||||||||||||||||||||||||||||||||||||||||||||||||||||||||||||||||||||||||||||||||||||||||||||||||||||||||||||