|
Feb. 2001 Vol. 222 No. 2
Outlook 2001: United States
|
U.S. ROTARY RIGS
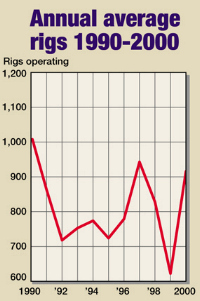
Coming back after 16 years
Starting the year 2000 at an average 775 active U.S.
rigs, activity steadily increased after February to three rigs below the 1,100 mark to average 916 for the
year. Despite industry claims of crew shortages and lack of equipment due to essentially no newbuilding and
parts scavanging, rigs have been put back to work in every significant U.S. producing area.
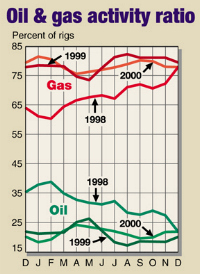
The major driver is, of course, high oil and gas
prices, which boosted budgets of both major and independent operators in second-half 2000, and their
expectations for 2001. The percentage of rigs drilling for gas vs. oil remained high, averaging 78.5% during
2000.
Considering
World Oil’s forecast of a 15.9% increase in U.S. wells this year, and a judgment call that wells
per rig may decline slightly due to more challenging targets, the average active count for this year is
expected to be 1,120 rigs, up 22% from 2000. This many U.S. rigs have not been active since 1985. Reed-Hycalog’s
2000 Rig Census indicates rigs are available to meet this expected increase.
Principal contributors to the increase last year were
Texas, Louisiana, Oklahoma and New Mexico. Every one of Texas’ 10 districts except one had significant
increases, namely gas areas in the far south and East Texas, and the far-west area’s Permian basin, which
spills over into southeastern New Mexico. 
 |
 |
 |
| |
Average
number of U.S. rotary rigs in operation1 |
|
| |
State or area |
2000 Avg. |
1999 Avg. |
% Diff. |
|
|
|
|
| |
Alabama-Onshore |
1.2 |
1.9 |
– 36.8 |
|
| |
Alabama-Offshore |
3.1 |
3.6 |
– 13.8 |
|
| |
Alaska-Onshore |
7.9 |
4.9 |
61.2 |
|
| |
Alaska-Offshore |
0.4 |
0.1 |
— |
|
| |
Arkansas |
3.8 |
2.6 |
46.2 |
|
| |
California-Onshore |
20.8 |
17.3 |
20.2 |
|
| |
California-Offshore |
3.4 |
1.6 |
112.5 |
|
| |
Colorado |
18.3 |
12.5 |
46.4 |
|
| |
Kansas |
22.2 |
7.2 |
208.3 |
|
| |
Kentucky |
5.0 |
5.5 |
– 9.0 |
|
| |
Louisiana total |
194.3 |
141.0 |
37.8 |
|
| |
|
North |
23.9 |
16.3 |
46.6 |
|
| |
|
Inland water |
16.0 |
15.5 |
3.2 |
|
| |
|
South |
36.7 |
20.9 |
75.6 |
|
| |
|
Offshore |
118.2 |
88.3 |
33.9 |
|
| |
Michigan |
2.5 |
2.1 |
19.0 |
|
| |
Mississippi |
11.3 |
7.3 |
54.8 |
|
| |
Montana |
6.5 |
4.2 |
54.8 |
|
| |
Nebraska |
0.6 |
0.3 |
— |
|
| |
New Mexico |
67.8 |
35.7 |
89.9 |
|
| |
New York |
3.2 |
2.5 |
28.0 |
|
| |
North Dakota |
13.4 |
5.8 |
131.0 |
|
| |
Ohio |
8.7 |
10.4 |
16.3 |
|
| |
Oklahoma |
99.2 |
61.6 |
61.0 |
|
| |
Pennsylvania |
8.6 |
7.9 |
8.9 |
|
| |
South Dakota |
0.2 |
0.5 |
— |
|
| |
Texas total |
342.6 |
226.3 |
51.4 |
|
| |
|
Offshore |
15.1 |
12.7 |
18.9 |
|
| |
|
Inland water |
1.7 |
1.1 |
54.5 |
|
| |
|
District 1 |
6.1 |
3.9 |
59.0 |
|
| |
|
District 2 |
20.2 |
15.3 |
32 |
|
| |
|
District 3 |
45.5 |
34.5 |
31.9 |
|
| |
|
District 4 |
61.8 |
45.9 |
34.6 |
|
| |
|
District 5 |
39.1 |
17.1 |
128.7 |
|
| |
|
District 6 |
39.1 |
21.7 |
80.2 |
|
| |
|
District 7B |
1.1 |
2.2 |
– 50.0 |
|
| |
|
District 7C |
16.3 |
11.5 |
41.7 |
|
| |
|
District 8 |
48.9 |
29.9 |
63.5 |
|
| |
|
District 8A |
18.1 |
8.7 |
106.9 |
|
| |
|
District 9 |
14.6 |
8.3 |
75.9 |
|
| |
|
District 10 |
16.7 |
13.7 |
21.9 |
|
| |
Utah |
15.5 |
8.7 |
78.2 |
|
| |
Virginia |
1.9 |
4.7 |
– 59.6 |
|
| |
West Virginia |
14.1 |
13.5 |
4.4 |
|
| |
Wyoming |
40.8 |
31.7 |
28.7 |
|
| |
Others2 |
0.6 |
1.3 |
– 53.8 |
|
|
|
|
| |
Total U.S. |
916.4 |
622.4 |
47.2 |
|
| |
Totals may not add due to rounding
1Source: Baker Hughes
2Includes Florida,
Georgia, Hawaii, Maryland, Oregon, Tennessee and Washington |
|
|
|
|
|

