Natural Gas: North American Outlook
NATURAL GAS: Igniting New Markets
|
||||||||||||||||||||||||||||||||||||||||||||||||||||||||||||||||||||||||||||||||||||||||||||||||||||||||||||||||||||||||||||||||||||||||||||||||||||||||||||||||||||||||||||||||||||||||||||||||||||||||||||||||||||||||||||||||||||||||||
 |
 |
Not all reserves are equal. Some can be produced more rapidly than others. The principal producing areas of the U.S., as listed in Table 1, are mostly in or adjacent to the Gulf of Mexico, or in the Rocky Mountains.
| Table 1. Lower-48 gas reserves, production at year-end 1999 | ||||
| Area | Reserves, Tcf |
Production, 1999, Tcf |
||
| Gulf of Mexico | 25.8 | 4.9 | ||
| Texas, East | 24.3 | 3.3 | ||
| Texas, West | 15.8 | 1.6 | ||
| New Mexico | 15.4 | 1.5 | ||
| Wyoming | 14.2 | 1.2 | ||
| Oklahoma | 12.5 | 1.3 | ||
| Louisiana | 9.2 | 1.4 | ||
| Other – 16 states | 40.5 | 3.3 | ||
| Total | 157.7 | 18.5 | ||
The Natural Gas Supply Association estimates that offshore Gulf of Mexico reserves are being depleted at a rate of 25 – 30% per year of remaining reserves. In other areas of the country, production / reserve ratios are substantially less, usually because the rock formations are less porous and cannot be depleted as rapidly. Further, many reservoirs have already been producing for many years and are well down on their respective deliverability curves.
Reserve additions in the gas-prone areas of the Gulf of Mexico are crucial to maintaining deliverability to Eastern markets. At last count, there were 181 rigs working in the Gulf, up from 151 a year ago. There are 37 Tcf of reserves located in non-producing reservoirs – usually behind pipe. Of these, 11 Tcf are in federal offshore waters. That is close to 40% of GOM reserves. Those reserves declined by 4% in 1999, but production remained essentially the same. It is imperative that GOM exploration move ahead briskly to assure the stability of markets for gas in the Eastern U.S.
The rig count is at a record high in the Gulf, but it is taking a lot longer to rebuild the reserve base to eliminate tight supply concerns than many had expected. While it is generally agreed that the reserves are in the ground, and that wellhead prices are sufficient to attract adequate financial support, we have moved on to an exploration lifestyle that is described by some as "just in time." It now appears that the concept has a two-year or more lead time from reaction to a price signal to meaningful reserve growth.
As a footnote, North Slope reserves, about 16 Tcf, were dropped from the reserve base in 1986, because a number of studies indicated that the cost of building transportation facilities from the North Slope to the Lower-48 was – and would continue to be – prohibitive. However, high prices have revived the prospect of building a pipeline to deliver gas from the North Slope and the McKenzie Delta, probably about 2010.
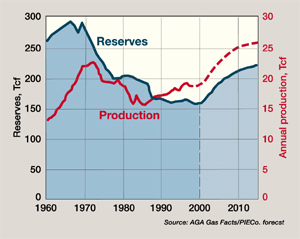
A historical note. U.S. gas consumption peaked at 22.6 Bcf in 1973, at about the time of the "oil crisis." Production fell off sharply, dropping below 20 Tcf/yr amid concerns over deliverability. As it turned out, the production decline that began in 1973 continued on for 10 years until 1983, before bottoming out at 15.8 Tcf/yr. FERC Order 636, and others, were put in place to stimulate the gas business. Significant changes that flowed from the FERC orders were the shift away from pipeline ownership of long-term contracts for reserves and the evolution of a spot market. Conceptually, the idea was to provide a means of opening the market to all players. The downside of the outcome is that the market is made by players in New York City.
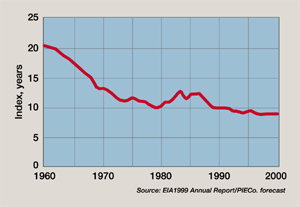
Reserve Life Index (RLI). This Index is used by many as a marker for the point where too much gas becomes not enough, or vice versa. It is another way to describe tight supply As shown in Fig. 2, the U.S. RLI has been in decline for virtually the entire time since 1960. As the reserve base shrinks, or simply stays flat, an increase in demand will push the marker down. Since 1996, the RLI has been below 9.0 years, a warning that – without some meaningful action on the part of the players – tight supply troubles and high prices could raise the issue of reregulation. And sure enough, we are in the middle of tight supply and some are calling for action.
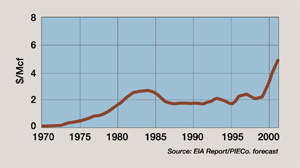
Wellhead prices. By 1984, the average wellhead price of gas had risen to $2.66 before slipping back during the "gas bubble" years that followed, Fig. 3. The post-NGPA drilling boom passed into history while producers were struggling to stay alive in a low-price environment. Over time, average wellhead prices have moved in a fairly narrow range, as shown in Fig. 3.
 |
However, given what has happened to the reserve base in recent times (modest decline) and currently-tight supply, we appear to be at an inflection point in gas price, as is evidenced by recent events on the NYMEX, when spot prices touched $10/MMBtu before dropping back slightly. The outlook is for spot prices to come down from the 1999 – 2000 winter peak and average about $4.50 – $5.00/MMBtu for the coming year.
In 2001, domestic gas production is projected to reach 19 Tcf, a 500 Bcf increase over 1999. Delays in Gulf of Mexico production and only marginal growth in the rest of the Lower-48 led to relatively unchanged production in 2000.
Unless deliverability improves substantially as a result of the record gas-well drilling activity going on, it is not likely that prices will moderate noticeably. Heightened conservation, fuel switching and efficiency gains will very likely take some of the edge off gas market growth.
Drilling. Gas-well drilling had already reached record levels well before the current runup. It is estimated that 15,000 gas wells were drilled in 2000, up 5,000 from 1999. During the 10-year period, 1990 – 1999, about 100,000 gas wells were drilled, connecting nearly 190 Tcf of new reserves. In the next 10-year period, we need to connect about 300 Tcf of new reserves to meet projected demand and maintain an RLI of about 8.5. The outlook is for 18,000 gas wells in 2001. The IPAA reports that producers are moving as fast as they can to put more rigs and crews in the field.
U.S. Demand
U.S. natural gas consumption in 2001 will probably reach about 22.6 Tcf, up from an estimated 21.9 Tcf in 2000, an increase of about 700 Bcf. Residential and commercial usage will lead the way, partly because of the below-normal weather early on in 2001.
Gas imports increased by an estimated 4.5% in 2000, and are expected to increase substantially in 2001 with the advent of additional pipeline capacity accessing Western Canada gas supplies, and increased deliveries from offshore Nova Scotia. LNG is back in the picture. Renovations of the Cove Point LNG terminal in Maryland and the Elba Island LNG terminal in Georgia are moving ahead quickly to take advantage of the tight supply situation and price spikes.
2001 Outlook
Economic growth, electricity demand and normal weather are expected to drive U.S. energy consumption in 2001 to 96 quads, an increase of 1.8%.
Consumption of all fossil fuels is expected to increase. Increase in coal consumption will be driven by higher utility demand, as well as stronger oil and gas prices. Natural gas consumption is expected to increase in 2001, driven mainly by higher usage in weather-sensitive markets. Stronger gas prices, particularly in comparison with less-expensive coal and residual oil, could serve to limit the growth of gas markets in the utility sector. Nuclear energy consumption is expected to decline in 2001. Hydropower availability is expected to increase slightly, assuming normal rainfall.
Energy efficiency – the measure of how well we utilize our energy resources, given higher prices for gas and oil – will likely improve as people find ways to cut energy waste.
Gas demand for industrial uses is expected to increase in 2001. Gas consumption by electric utilities is expected to increase due to increased generation, an increase of 4.7% year-over-year. Gas exports, primarily to Mexico, are expected to increase substantially as the Mexican economy makes some headway. Gas imports from all sources will increase to 4+ Tcf in 2001.
Storage providers have taken on additional roles, of arbitrageurs of price differentials between seasons and regions. Storage availability will be a significant factor in the location of large, gas-fired electric generation plants, with their highly-volatile load characteristics. Distributed generation is catching on and will have a role to play in meeting the market for electricity.
E-commerce is the name of the game. It is the tail that wags the tiger. The efficiency of e-transactions will be the vehicle operators will use to reduce the cost of doing business.
Canada
Canada has about 55 Tcf of remaining reserves out of a 650+ Tcf resource base, Table 2.
| Table 2. Canada: additions, production and reserves, Tcf | |||||||||
| 1994 | 1995 | 1996 | 1997 | 1998 | 1999 | 2000 est. |
|||
| Additions | 2.8 | 5.8 | 1.8 | 1.6 | 4.2 | 4.5 | 4.5 | ||
| Production | 5.0 | 5.0 | 5.6 | 5.6 | 5.6 | 6.0 | 6.5 | ||
| Remaining reserves | 63.0 | 64.0 | 60.0 | 59.0 | 58.0 | 57.0 | 55.0 | ||
| R/P ratio | 12.6 | 12.8 | 10.7 | 10.5 | 10.4 | 9.5 | 8.5 | ||
Canadian gas marketing has experienced strong growth in recent years, to the extent that production has outstripped reserve additions for the past several years, resulting in a continuing decline in remaining reserves. Exploration is up sharply, particularly in British Columbia, and is starting to edge into the Northwest Territory. This would fit in well with the prospects for a gas pipeline from the North Slope of Alaska.
Western Canada is second only to the U.S. Gulf of Mexico and environs as a gas supply resource. In fact, the majority of Canada’s gas reserves are located in the Western Canada Sedimentary Basin (WCSB), with a lesser amount located offshore Nova Scotia. The decline in the R/P ratio raises speculation on the ability of Canadian supply to meet both Canadian and export markets in the short-term.
Gas well drilling has been on the rise since 1995, and is expected to pass 8,200 wells in 2000, 8,800 in 2001 and 9,000 in 2002 – a 40% increase between 1999 and 2002. Recent production data show that there has been a substantial decrease in initial productivity rates for wells across the WCSB, due in part to the drilling of an increasing number of shallow wells. It is expected that drilling activity will increase most in the western and northwestern areas of the WCSB, which have deeper and more productive wells – albeit more expensive to drill.
Despite the drilling of a record number of wells, deliverability has increased only marginally. The per-well average has been declining, due in part to the drilling of an increasing number of low-deliverability shallow wells. To offset the annual decline in production from existing wells, production from new wells must amount to 20% of current production, a formidable barrier to increasing production.
Mexico
Mexico is reported to have 63 Tcf of proved reserves included in a resource base estimated to be 600+ Tcf.
Mexico has large gas resources relative to its rate of production and consumption. It has the potential to be both a major producer and consumer, and it is certain to take on a more significant role in North American gas development in the future. The Mexican government is aggressively promoting gas industry development. To that end, the government has opened up the transmission, distribution and storage sectors of the gas industry to competitive bidding by private industry, as well as electric generation. PEMEX will, for the time being at least, retain its monopoly on exploration and development activities.
Gas production is expected to increase substantially, Table 3. Most of the increase will result from the development of gas fields in the Burgos basin in Northeastern Mexico, aimed at doubling production to 1.4 Bcfd by 2001.
| Table 3. Mexico: Production, demand, imports, Bcf | |||||
| Production | Demand | Imports | |||
| 1995 | 997 | 1,052 | 61 | ||
| 2000 | 1,515 | 1,608 | 94 | ||
| 2001 | 1,554 | 1,681 | 127 | ||
| 2002 | 1,625 | 1,809 | 184 | ||
| 2003 | 1,653 | 1,878 | 225 | ||
| 2004 | 1,682 | 1,913 | 230 | ||
| 2005 | 1,777 | 2,007 | 230 | ||
| 2010 | 2,111 | 2,342 | 230 | ||
| 2015 | 2,519 | 2,749 | 230 | ||
| Source: GRI Insights, November 2000 | |||||
However, Mexico is expected to be a net importer of gas from the U.S. for the foreseeable future.
Summary
The data tend to point toward a period of adjustment. Exploration will have to move into high gear to keep pace with dramatic increases in demand in the coming decade. Gas-well drilling will continue to increase, subject only to the availability of rigs and crews. E-commerce will dominate the way we do business.
Canada will be stepping up its resource development program. Mexico will be moving up the curve of energy development and utilization, but will need gas from the U.S. for the foreseeable future.
Look for more imports, including LNG, to bolster U.S.
supply alternatives. Look for energy efficiency and conservation to come back into vogue, as consumers seek
ways to deal with higher energy costs. There may not be a 30 Tcf market out there.
![]()
The author |
|
 |
Leonard V. Parent, a World Oil contributing editor, holds a BS in chemical engineering from Purdue University, and has been active in the gas business since 1950, beginning with Natural Gas Pipeline Co. of America. He later joined Trunkline Gas Co. in Houston and, in 1968, was appointed to corporate planning for Panhandle Eastern. Mr. Parent took early retirement after 26 years with Panhandle and Trunkline, and embarked on a second career as a consultant and publisher of The Gas Price Report and The Gas Price Index. |
| Part 1: Exploration Methods | |
| Part 3: HP/HT Drilling and Completions | |
| Part 4: Tight Formation Stimulation | |
| Part 5: Sour Gas Handling | |
| Part 6: Anomalously pressured zones | |
| Part 7: Gathering and Compression | |
| Part 8: Monetizing Stranded Gas | |

