Pilot test demonstrates how CO+B1625 injection enhances coalbed methane recovery
Pilot test demonstrates how CO2 injection enhances coalbed methane recoveryLanny Schoeling,* Kinder Morgan CO2 Co., LP., and
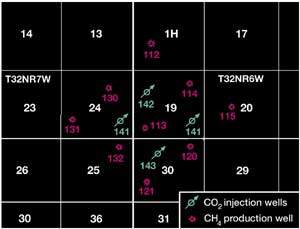
Mike McGovern, Burlington Resources Inc. Bottom line. Since 1995, Burlington Resources has been conducting a pilot test of enhancing coalbed methane recovery through carbon dioxide (CO2) injection. The objective of the CO2 injection pilot is to accelerate recovery, displace methane with CO2 and recover incremental reserves. To date, 4.7 Bcf of CO2 has been injected with only limited CO2 breakthrough. Since primary production was increasing throughout most of the period due to dewatering, lowering of backpressures and well restimulations, reservoir simulation was an essential tool in analyzing pilot performance. It is estimated that injection to date will yield 1.6 Bcf of incremental reserves. Field history. The Allison pilot is located in the San Juan basin in northern New Mexico. The coalseam target at the Allison Unit is the Cretaceous Fruitland coal formation. Average depth is 3,250 ft, with an average net thickness of 35 ft. Initial reservoir pressure was 1,650 psi, and the system was believed to be nearly 100% water saturated. A map of the Allison Unit pilot is presented in Fig. 1. The nine Allison Unit production wells affected by CO2 injection were originally completed on 320-ac spacing and placed on production starting in 1989. Initial gas and water rates averaged 100 Mcfd and 100 bwpd per well, respectively. Primary production steadily increased through 1999 due to dewatering, lowering of backpressures and reservoir re-stimulations.
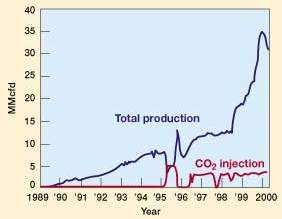
At the time CO2 injection was initiated in 1995, average production rates per well were 1,000 Mcfd and 30 bwpd, as shown in Fig. 2. Reservoir pressure in the flood area had declined to 1,200 psia. The initial produced gas composition of 95% methane and 5% carbon dioxide had remained relatively constant.
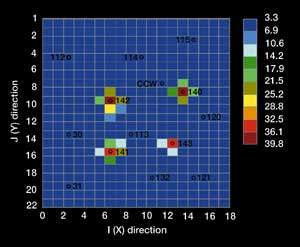
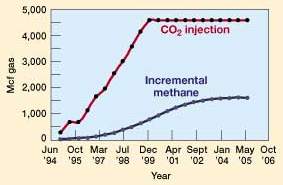
In the spring of 1995, a 36.2-mi, 4-in. diameter CO2 pipeline was installed to deliver CO2 from the Kinder Morgan Permian basin CO2 supply line to the Allison Unit. CO2 is received at a pressure of 2,200 psia. Pipeline friction losses and elevation heads result in wellhead injection pressures of 1,550 psia. Four injection wells were drilled at roughly 160-ac infill locations. The injection wells were perforated and acidized, and CO2 injection initiated in May 1995. Initial total injection rate was as high as 5 MMcfd, but declined quickly for the first few months to 4.2 MMcfd. This rapid decline in injectivity was possibly due to near wellbore coal matrix swelling caused by adsorption of CO2 and transient pressure buildup near the injectors. After 6 months, injection was temporarily halted for evaluation. Since resuming injection in July 1996, the injection rate has been fairly constant at about 3 MMcfd, although injection ceased again temporarily late in 1997 so that surface CO2 lines could be buried. A plot of production and injection rates is provided in Fig. 2. Five of the production wells were shut in for a 6-mo period at the start of injection, a step thought to facilitate CO2-methane transfer in the reservoir and limit CO2 breakthrough. CO2 breakthrough, a pre-project major concern, has not been a significant problem, occurring only on a limited basis. CO2-cut in Well 113, the well with the highest breakthrough, is now 9%, up from 5% prior to CO2 injection. Reservoir simulation. Quantifying incremental methane production from CO2 injection was difficult due to several factors. The injected volume relative to the produced volume is very small (producing 30 MMcfd, while only injecting 3.5 MMcfd). Primary production was increasing at the start of injection and continued to rise through March 2000 due to dewatering, lowering of backpressures and well restimulations. Since there was not an established decline, reservoir simulation was essential for estimating incremental recovery. The simulator selected to evaluate the pilot’s incremental performance is COMET 2 – a three-dimensional, two-phase, single, dual or ‘triple’ porosity simulator for modeling gas and water production from coal seams. It has a binary gas sorption feature, which defines the non-linear relationship between free and adsorbed multi-component gas mixtures (methane-nitrogen and methane-carbon dioxide) as a function of methane concentration using extended Langmuir theory. The simulator was used to match actual primary and enhanced production in the Allison Unit and then to estimate the fraction of actual production attributable to CO2 injection. The following procedure was used to estimate incremental methane production. First, a history match of total performance (including CO2 injection) was completed, driving the model with actual injection and production rates. Flowing bottomhole pressures derived from this history match were used as input to drive a second projection, representing what primary production would have been without CO2 injection (assuming the same operating conditions). Subtracting the second case (primary production) from the first case (enhanced production) yields incremental recovery rates. Both cases were projected into the future with the same flowing bottomhole pressure assumptions. The simulation grid size was (18 x 24 x 4). Prior to production, the reservoir was assumed to be 100% water-saturated at an initial pressure of 1,650 psia. Isotherm curves were taken from lab core studies, and the Langmuir volumes for the methane and CO2 were 33.2 and 50.09 Mcf/cf, respectively. Langmuir pressures for methane and CO2 were 539 and 239 psia, respectively. Areally, cleat permeability and porosity were estimated from production data. Once overall material balance calculations matched, the relative permeability was varied to get a reasonable field match on water production. Individual wells were matched by varying skin factors on wellbores. Permeability was varied as a function of reservoir pressure to simulate permeability growth due to matrix shrinkage effects. The original gas in place in the model was 131.5 Bcf. Fig. 3 (data as of July 2000) illustrates significant CO2 adsorption near the injection wells, illustrating why CO2 breakthrough has not been a major problem. Cumulative CO2 injection has been 4.7 Bcf to date, with ultimate, incremental methane recovery estimated at 1.6 Bcf, assuming injection is discontinued. Fig. 4 illustrates incremental methane production as a function of cumulative CO2 injection.
Lessons learned. Much was learned from the Allison Unit project, which is applicable to future commercial projects. Effectiveness of reservoir simulation in evaluating project performance was proven. From a process standpoint, field performance established that feared CO2 breakthrough was not a major problem. With breakthrough not being a major problem, future projects might avoid the shut-in of producers for a period of time and begin injecting CO2 at higher rates. Incremental recovery equates to a CO2 requirement of about 2.9 Mcf of CO2 per Mcf of incremental gas, a guiding parameter for other operators to consider when they evaluate the attractiveness of CO2-enhanced coalbed methane recovery. In the San Juan basin, CO2 prices vary from 10 to 13% of natural gas prices, depending on the demand situation for carbon dioxide.
|
||||||||||||||||||||||
- Applying ultra-deep LWD resistivity technology successfully in a SAGD operation (May 2019)
- Adoption of wireless intelligent completions advances (May 2019)
- Majors double down as takeaway crunch eases (April 2019)
- What’s new in well logging and formation evaluation (April 2019)
- Qualification of a 20,000-psi subsea BOP: A collaborative approach (February 2019)
- ConocoPhillips’ Greg Leveille sees rapid trajectory of technical advancement continuing (February 2019)

