48th annual Reed-Hycalog rig census
DRILLING TECHNOLOGY48th annual Reed-Hycalog rig censusUtilization rebounds, while U.S. rig fleet contracts slightlyPatricia Neal, Commercial Marketing Manager, Reed-Hycalog, Houston
Statistical Highlights Key statistics from the census include the following:
Rig Deletions – Aging Fleet Needs Capital Improvements In last year’s census, the effect of lower commodity prices through 1998 was seen in reduced rig availability numbers. Some carryover of depressed prices remains despite the fact that a recovery occurred in 1999. Eighty-two rigs were deleted from the U.S. fleet this year (Table 1), with reductions reported in five categories, including:
Previously, census rules excluded rigs from the available count if they required a large capital expenditure to be put back to work – over $100,000 for land rigs and $1,000,000 for offshore rigs. In 1999, census rules were clarified to exclude drill pipe from the monetary limits placed on rigs requiring a capital expenditure. Rig owners reported another 40 units requiring a significant capital expenditure this year, similar to last year’s 46 rigs. Rig owners were also asked if they had capital improvements planned for the next 12 months for each rig they owned. Contractors responded that during the next year, 11% of available units are scheduled for capital improvements, versus 5% last census. This increase is an indication of industry optimism as well as the necessity of holding together an aging rig fleet. Rigs auctioned for parts or cannibalized to support other units decreased after a year of particularly heavy attrition. Many of last year’s cannibalized rigs are being resurrected in this year’s census as rigs assembled from components. Twenty-four units were scrapped over the past year, versus 41 in 1999. The number of rigs deleted from the census because they were stacked for more than three years rose by 12 this year. These 12 (out of the 17 rigs stacked more than two years in last year’s census) were removed because of inactivity, while five were reactivated. Just two rigs were dropped from the available count in 1999. Rigs destroyed during the past year comprise another category for deletions. Owners reported two units as having sustained fire damage beyond repair. Rig movements into and out of the U.S. are tracked in the census. Four rigs moved out of the U.S. this year, versus seven last year. Two went to Brazil and two to undisclosed locations. Considering that four rigs moved out of the U.S. this year, while 12 moved in, there was a net increase of eight units resulting from rig moves. Movement into the U.S. is covered below. Rig Additions – Most Are Assembled From Used Components Over the past year, the drilling industry has been mobilizing additional rigs to meet growing needs. Seventy-four rigs were added to the U.S. fleet in 2000, significantly more than last year’s 39, but not enough to offset reductions. Fleet additions fall into one of four categories, (Table 1):
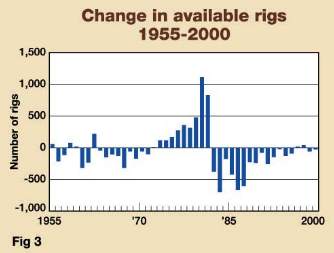
Units assembled from components numbered 34 this year, up from nine last year. This indicates that the supply of rigs previously deleted from the census was not exhausted by cannibalization, as previously thought. The number of rigs brought back into service increased slightly in this year’s census. Twenty-two rigs were reactivated, versus 18 in 1999. Each rig had been counted in previous census tabulations, but was subsequently removed due to becoming inactive or inoperable. Twelve rigs were brought into the U.S. during 2000. Six offshore units came from the North Sea, three from Africa, two from Mexico and one from an unknown origin. Six newly manufactured rigs were added this year, the majority as a result of plans made before commodity prices bottomed out and then recovered. Owners reported building five new offshore rigs and one land unit. All of the offshore rigs were built for work in the Gulf of Mexico. The new land rig is working in Louisiana. Including this year, 19 brand-new rigs have been built during the past three years. Although this is not a considerable number, it indicates more optimism in recent years than the prior 10 years, when an average of only 1.3 new rigs were added per year. Total rig additions numbered 74, while deletions totaled 82. Therefore, the net change in the rig fleet this year was an eight-unit decrease, indicating an overall stability in the U.S. rig fleet, Fig. 3.
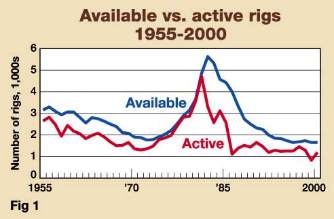
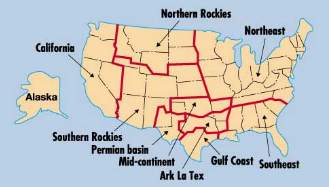
Drilling Activity Climbs As anticipated, census statistics reveal a sizable increase in drilling activity during the past 12 months. The 2000 active count was 1,215, up from 860 in 1999. This 41% gain is the largest year-to-year increase in census history. The methodology used to count active rigs for the Reed-Hycalog census is different from other active weekly rig counts that record units drilling during a single day. The census counts a rig as active if it has "turned to the right" any time during a defined 45-day period (this year’s period was between May 6 and June 19). Therefore, Reed-Hycalog statistics always will be higher than other reported counts, because a longer time period is used to monitor rig activity. There was considerable variance in regional activity levels, but all U.S. regions, except for Alaska, reported more rigs working than a year ago, Table 2. Regional unit increases were as follows: Gulf Coast (+77), Permian basin (+61), Southeast states (+51), ArkLaTex (+48), Southern Rockies (+47), Mid-Continent (+32), California (+29), Northeast states (+10), Northern Rockies (+2) and Alaska ( – 2).
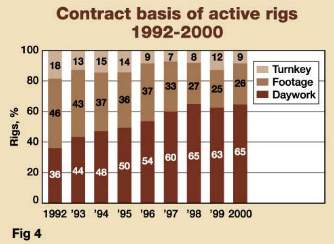
The 421 available rigs that did not drill during the census period were classified according to the length of time they had been idle. Rigs stacked less than one year numbered 175; one to two years, 174; and two to three years, 72. Census aging rules state that any rig stacked for longer than three years will be removed from the available fleet. Adding the 175 rigs stacked less than one year to the 1,215 active units in the census provides the total number of rigs that drilled sometime during the past year. The full-year utilization figure indicates that 1,390 out of 1,636, or 85% of available rigs, were put to work by rig owners over the past year, as compared to 89% in last year’s census. Types of contracts covering the active rig fleet illustrate the changing economic environment contractors have faced the past few years. This year, daywork contracts rose to 65% of all contracts, as commodity prices climbed and spending budgets followed suit. Last year, as oil and gas prices tightened drilling budgets, contractors saw the percentage of day work contracts drop slightly to 63%. Footage contracts are up just one percentage point to 26%, while turnkey contracts were down three percentage points to 9% this year, Fig. 4.
Other information, which was gathered for the last well drilled by each active rig, includes the following:
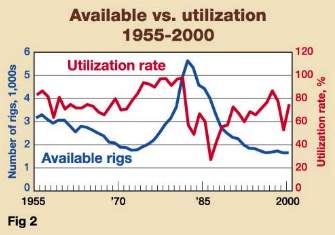
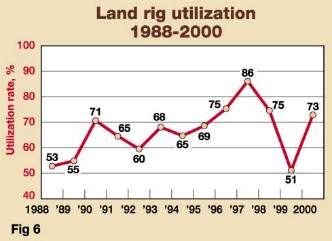
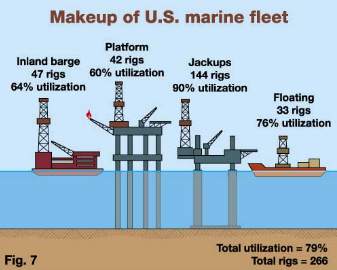
Rig Utilization Rebounds As an indicator of industry health, rig utilization measures supply and demand balance. This year’s utilization, the ratio of active to available rigs, showed a notable increase of 22 percentage points. The 2000 utilization rate was 74.3%, reaching slightly beyond the historical average of 73%. Last year’s 52.3% utilization was the lowest since 1987. Nine out of 10 U.S. regions cited increases in utilization for 2000. The only region reporting a drop was Alaska – down to 25% from 30% in 1999. California showed the greatest improvement – up thirty-three points to 62%. Figures for other regions were as follows: Gulf Coast, 82% (+28 percentage points); Southern Rockies, 79% (+28); ArkLaTex, 82% (+26); Permian basin, 74% (+26); Mid-Continent, 73% (+19); Southeast states, 76% (+18); and the Northern Rockies, 49% (+5). Looking at land rigs and offshore rigs separately, gross land rig utilization hit 73%, up from 51% in 1999, Fig. 6. Offshore utilization has been stronger than the land ratio for the past several years and this continued in 2000. This year’s marine fleet utilization was 79%, up from 62%. According to the census, bottom-supported and floating rigs were in greatest demand. Utilization for these two types of rigs was 90% and 76%, respectively, Fig. 7. Inland barge utilization rose from 46% to 64%, while platform rig utilization climbed 18 percentage points to 60%. It is also worth mentioning that rigs in every depth capacity showed utilization increases in 2000, Table 3.
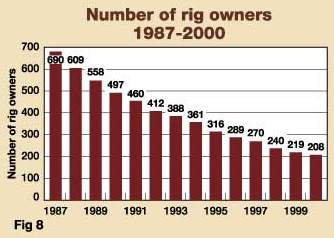
As previously stated, overall gross utilization was 74.3% for the 2000 census. This rate does not necessarily mean that rigs were working 74.3% of the time, since a rig drilling on just one day during the 45-day census period would be counted as 100% utilized. However, rig owners were asked to estimate the number of days during the 45-day period their rigs were actually on jobs (moving days not counted). The average number of days each unit was utilized was 39 this year, up from 33 in 1999. Applying this factor to the 74.3% gross utilization rate gives an "on-the-job" utilization of 54%, significantly more than the 38% reported last year. Large Owners Gain More Rigs Consolidation continues to best describe the industry’s dynamics in 2000. For more than a decade, the number of rig owners counted in the census has been on the decline. This total dropped by another 11 companies this year to 208, Fig. 8. Less than one-third of all rig owners that were in business in 1987 still remain today.
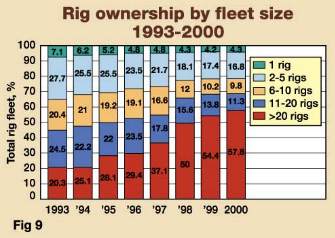
Over the past year, 140 rigs, or approximately 9% of the fleet, changed ownership through mergers or acquisitions. The 140 units do not include those that were sold and subsequently scrapped for parts. Contraction in the industry put even more units in the hands of larger rig owners. More than half of the available U.S. fleet (57.8%) is controlled by companies that hold 20 or more rigs, up three percentage points from last year, Fig. 9. This is another significant increase, considering that just four years ago, large companies owned less than 30% of all units. The average rig owner now holds 7.9 rigs, up from 7.5 last year. Drilling contractors remain the primary owners of most drilling rigs, with 95% of all units, a decrease of three percentage points over the past year.
Contractors Optimistic For Long Term A contractor survey performed in conjunction with the rig census provides additional insight into the industry. Thirty-two contractors from across the U.S. chose to participate in this year’s survey, representing about 15% of the industry. The number of responses from each region is listed below:
For 11 years, contractors have been asked to rank a set of issues by importance to their business. This year, "crew availability" was their highest concern, surpassing "rig rates," which had been the highest for the past two years, Table 4. An acute shortage of qualified labor now limits growth more than rig rates, as contractors try to put additional rigs back to work. Seventy-one percent of contractors surveyed have an ongoing program in place to train additional crews.
"Rig rates" ranked second on the list of issues affecting contractors. "Availability of rig parts," "drill pipe replacement," and "aging of rig equipment" were third, fourth and fifth, respectively, and were all considered very close in importance. These same issues have consistently been the top five concerns over the past few years, switching positions as industry conditions fluctuate from year to year. Ninety-one percent of contractors surveyed said that their rig activity was up in 2000, the average being 39%. Almost all cited higher oil and gas prices as the reason for this increase. Contractors seem relatively confident that commodity prices will remain stable, and that rig activity for 2001 may increase another 27%, on average. Eighty percent of contractors reported higher rig rates compared with last year. According to survey data, land rig rates in actual dollars have averaged $6,657/day (excluding Alaska) during the past month (May-June 2000), representing a 21% increase from day rates cited one year ago. In addition, land contractors were asked to estimate the change in land rig day rates, Table 5. Estimates revealed an average jump of almost 15%, somewhat less than the "actual dollar" calculations. This average increase, however, seems to more than offset the average estimated decline from last year. Offshore rates averaged $23,800/day, and contractors tell us that this is almost a 75% increase over this time last year, although offshore data is not statistically significant due to sample size.
Many contractors reported elevated expenses over the past year. Most plan to spend more on rig maintenance during 2000, up 14% on average. This seems to climb annually, as costs rise and the rig fleet continues to age. Seventy-four percent of contractors cited increases in crew labor rates as well, with an average increase of 9%. In last year’s census, contractors were asked to estimate the percentage they could increase drilling days if crews or capital, individually, were not constraints. Then, the respondents estimated they could increase drilling 50% and 61%, respectively, if crews and capital were not restrictions. This year, as expected, contractors reported less slack in the market, estimating just a possible 21% and 22% increase, respectively. Despite continued consolidation, competition remains strong. When contractors were questioned about the percentage of wells they drill under alliance contracts with other service companies, 21% reported participating in such contracts on just 2% of wells, down from a 5% share in 1999. Also, for the fourth consecutive year, the number of contractors typically bidding on a well averaged close to five, not declining, as might be expected, from fewer competitors remaining in the business. Most contractors now feel that the hardest times are behind the industry and they are cautiously optimistic as long as product prices are sustained. Mergers and acquisitions are predicted to accelerate though in the current economic environment and as contractors position themselves in specific markets. Many rig owners see this "weeding out" as good for the industry in the long term. When questioned about plans for the next five years, contractors generally were optimistic, but mixed in their responses, Table 6. More than half (56%) have plans to expand their fleets since industry economics have improved. Twenty-eight percent are looking for merger opportunities. Twenty-two percent have no plans for change and are probably enjoying modest profits while times are good. A significant number, 22%, are exploring international opportunities.
Utilization Increase Predicted Higher commodity prices have caused the U.S. industry to experience improved activity levels. This increased demand has led energy companies to begin budgeting more for drilling. In addition, contractors say that 58% of their stacked rigs have a greater than 50% chance of going back to work in the next twelve months and that they are bidding jobs with all but 2% of the available fleet. Reed-Hycalog predicts that activity will rise again in 2001, although not as much as during the past year. Available rigs generally will stay at this year’s level as increased demand is satisfied by rigs that are currently stacked. In light of this knowledge, the demand / supply ratio will further improve over this year’s level. Reed-Hycalog anticipates an active rig count of 1,275 units, causing utilization to climb to 78%. This level may not be worth applauding, but considering the disappointing drop in 1998, it is encouraging that the industry can recover so quickly.
Acknowledgment
|
||||||||||||||||||||||||||||||||||||||||||||||||||||||||||||||||||||||||||||||||||||||||||||||||||||||||||||||||||||||||||||||||||||||||||||||||||||||||||||||||||||||||||||||||||||||||||||||||||||||||||||||||||||||||||||||||||||||||||||||||||||||||||||||||||||||||||||||||||||||||||||