Using 4C data for predicting lithology and fluid type
Using 4C data for predicting lithology and fluid typeThree case studies show how advances in marine 4C-data analysis allow clearer imaging of reservoirs, and discrimination of fluids and rock propertiesEivind Fromyr and Santi Randazzo, PGS Reservoir Services, Inc., Houston
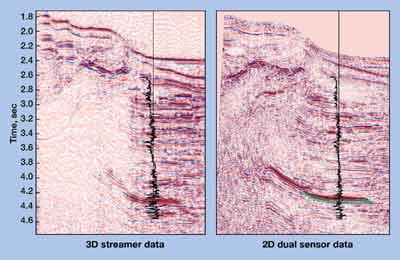
This article does not address processing and interpretation issues on a detailed technical level, but it does discuss results of three case histories, each showing a different application of marine 4C data. The applications cover both imaging and characterization, including improved imaging in low-impedance P reservoirs, how sand / shale content can be inferred from multicomponent attributes, and fluid-discrimination problems. Introduction A conventional marine source gives rise to the full complement of wave types through conversions, chiefly upon reflection at any impedance contrast. 4C acquisition makes it possible to record the entire vector wavefield. Imaging of structures beneath gas clouds is a well-established application of this technology. Additionally, acquisition with stationary receiver systems on the seabed enables better imaging of complex structures due to improved aperture and application of dual-sensor summation to remove waterborne multiples. Generally speaking, in addition to a P-wave section, recording and processing an S-wave section gives a second set of independent information that can be combined with P-wave velocity (VP) to yield Poisson’s ratio, or simply the velocity ratio VP/VS. This allows better determination of lithology and pore fluids.1 This cannot usually be done with P-wave data alone, because many different rocks with different fluids have similar P-wave responses. Multiple Removal / Subsalt Imaging Three aspects of marine 4C data are the focus of the following case history. First, seabed sensors offer semistationary acquisition with free geometry that allows optional wide azimuth and a full range of offset, including true-zero offset. Second, it is well known from shallow-water OBC data that waterborne reverberations can be removed by combining hydrophone and vertical-geophone wavefields.2 Third, in deepwater seabed acquisition, the effective aperture for a given nominal source-offset range increases relative to streamer geometry. A 2D/4C line can prove additional reserves due to improved imaging beneath a salt structure. Such data was collected in the Gulf of Mexico. The field was covered by a 3D streamer survey, and a comparison of the 2D/4C line and an extracted 2D line from the 3D cube is shown in Fig. 1.
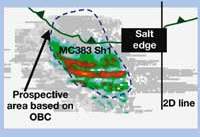
The illumination advantage, combined with the multiple suppression technique (no destructive FK or Radon), are responsible for the improvement that allows further mapping of the reservoir reflector beneath the salt structure. Imaging of both the base of the salt overhang and the salt diaper flank was also improved. Standard prestack time processing was applied, as well as a spectral-balancing technique prior to dual-sensor summation. Projecting the additional pay into the 3D volume indicates the potential increase in estimated reserves, Fig. 2. Full 3D acquisition would be required to prove this in detail.
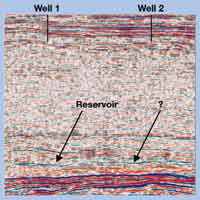
Low-Impedance Reservoir Characterization Many Paleocene sandstone reservoirs in the North Sea represent combined stratigraphic and structural traps. This particular case has a low-relief anticline, and the reservoir is shaling out toward the east. On conventional seismic, the reservoir reflector is characterized by relatively good reflectivity in the west, which gradually weakens moving eastward, Fig. 3.
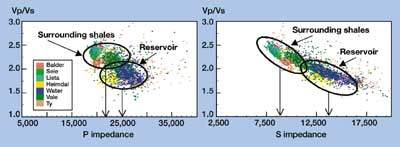
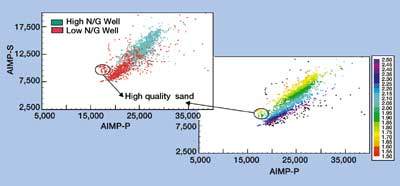
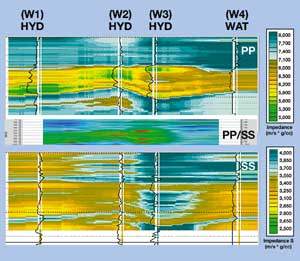
Typically, these Paleocene reservoirs are difficult to interpret, since the reservoir reflector becomes too weak to identify over the whole field. In Amplitude vs. Offset (AVO) terms, this is a Class-II situation. These reservoirs tend to be very heterogeneous, and shaling out of the sand makes delineation and exploitation difficult. They are typically associated with a high number of delineation wells to minimize uncertainty in reserve estimates. Converted-wave information will help in the structural imaging of such reservoirs and better define shaling out of the sand. This example explains why this is so. A 2D/4C seismic line was acquired passing through the two wells in Fig. 3. Well 1, on the left, has good reservoir-quality sand and high net / gross. Well 2, on the right, shows a reservoir section with very low net / gross and only a few sand lenses of good quality. Analysis of available logs from the two wells explains why the P-wave seismic is poor and why converted waves will give a better image. Fig. 4 shows cross plots of Well 1 in terms of VP/VS vs. both P impedance and S impedance. These indicate that there is stronger impedance separation between the sand and the surrounding shale in the S domain than in the P domain. Fig. 5 shows P and S impedance for the reservoir interval in both wells; as shale content increases, impedance contrast decreases for both P and S.
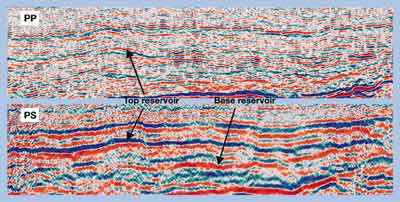
Due to higher initial separation in the S domain, a sufficient impedance contrast is still present there. P-impedance contrast has decreased so much that reflectivity between the reservoir formation and the surrounding shale disappears and, hence, the reservoir becomes transparent. The seismic fully supports log observations, Fig. 6. In the PP section, the reservoir reflector weakens and becomes difficult to follow moving from left to right. In the PS section, however, the reservoir reflector is strong all the way through. In addition, one can identify the reservoir base and thereby confirm thinning of the reservoir formation observed in Well 2.
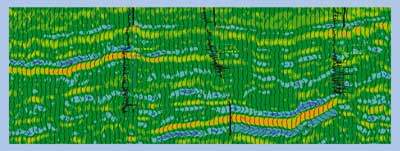
The logs were further analyzed to investigate the second objective – which is related to lithology – and especially to predict shale content. Fig. 5 shows the same cross plot between P impedance and S impedance for both wells, but color-coded according to well location and VP/VS ratio. One can observe good separation between sand and shale, about 20%, which should be observable on the seismic data. Since this is a low P-impedance case, AVO on P data does not appear attractive. With a direct PS observation, a VP/VS attribute must be derived from the seismic data with sufficient resolution. This may be achieved by using PP and PS amplitudes in the following way. For an angle-limited stack, it can be shown that:3 By combining this with the fact that VP/VS is proportional to the ratio of P and S impedance, the following procedure should work. Correlate the main geologic markers and compress PS to PP time and then invert both the PP and PS data to give acoustic-impedance estimates. By dividing the two impedance sections, obtain the instantaneous VP/VS attribute. Since this is stacked, converted data, an amplitude correction must be applied to the PS data before inversion. The instantaneous VP/VS section is shown in Fig. 7; the reservoir interval is characterized by a low VP/VS value on the left side which increases gradually as one moves to the right. This dataset shows degradation of reservoir quality relatively close to Well 1.
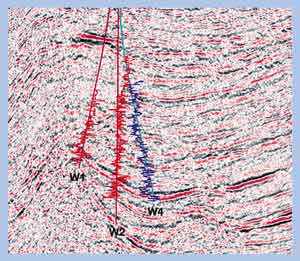
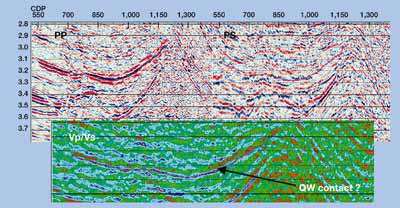
The above procedure works well in 2D with simple structures. A more general method that can also be used in 3D must be horizon based. It is clear that there are a number of challenges involved; among them is the attempt to correlate events from PP and PS in a common domain, e.g., depth. With well calibration, it should be possible to achieve quantitative estimates – in a geostatistical sense – that can be used in the final volumetric calculation. This would require 3D data. Fluid-Discrimination Aspects One of the ultimate 4C acquisition goals is to be able to discriminate lithology and fluids sufficiently to assist in determining the volume of gas, oil and water. This is a challenging task, and the industry needs to learn how to do this from theory and case studies. There is a complicated interplay of lithology factors and fluid factors. In general, one should be able to benefit from P and S imaging combined with AVO analysis of both wave types. In this case study from a Gulf of Mexico field, it is shown that, despite inherent ambiguities, it may be possible to associate certain seismic attributes with the physical subsurface. Geostatistical methods combined with well control may offer a workable technique. Calibration based on field-specific knowledge may prove to be absolutely necessary. Techniques developed in this branch of geophysics have the potential to become fundamental elements in applying the same technology to reservoir monitoring. Since this is an immature area, the results that follow are indicative in nature and should be interpreted with caution. The problem was determining the oil / water contact. This turned out to be difficult based on any attributes derived from P-wave data. Fig. 8 shows the P-wave data through three wells with wet sand encountered in the down-flank well, indicated in blue.
Available log data was used to generate a simple stratigraphic model for PP and SS. The derived VP/VS attribute, shown in the middle of Fig. 9, illustrates P and S impedance in color on top and bottom, respectively. Note that the reservoir has been flattened.
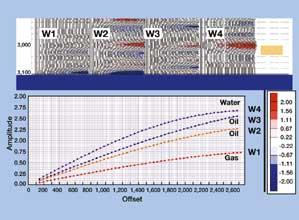
Fig. 10 shows a similar, higher VP/VS pattern for the wet sand. Two interesting aspects relevant to the above observations were investigated. First, the relative amplitude of PS with offset was modeled for each well based on well-log data, Fig. 11. The wells are annotated as gas / oil / oil / water, and a different response was observed than would be expected from a single-interface model with average properties and simple fluid substitution. This infers intricate response and tuning effects.
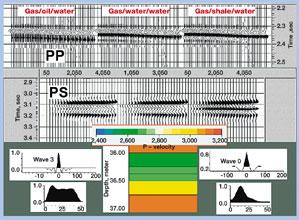
A simple three-layer model was constructed that contained the following fluids / solids: gas / oil / water, gas / water / water and gas / shale / water. The model was coarse enough to avoid tuning effects. AVO response was calculated both for PP and PS, Fig. 12. Among the possible observations is one simple fact: Lithology changes, if present, will most likely be a significant factor in the total response.
In some cases, lithology prediction and fluid discrimination may be linked in ways that may simplify analysis. It will always be a challenge to discriminate between fluids and lithology simultaneously. Well-log information will, most likely, always be necessary. Ultimately, even if it can only be done in a geostatistical sense on a case-by-case basis, the economic benefits will be significant. Conclusion Use of dual-sensor data for P-wave imaging can be beneficial in deep and
shallow water and lead to significant improvements, including improved imaging in low-impedance P reservoirs.
Associated with this, it has been shown how sand / shale content can be inferred from multicomponent
attributes. Fluid-discrimination problems will benefit from the additional converted-wave information, since
lithology changes can now be analyzed.
Acknowledgment This article was originally presented at the 2000 Offshore Technology Conference, Houston, Texas, May 1 – 4, 2000, as OTC 11907 and is used with permission. Literature Cited
The authorsEivind Fromyr earned an MS in Physics from the University of Oslo in 1982. Thereafter, he worked for Geco Prakla until 1986. From 1987 to 1995, he was employed by Read Well Services. Then, in 1995, he joined PGS Reservoir, where he currently serves as vice president of Geophysical Technology, Reservoir Services, Houston. Santi Randazzo earned his MS in Geophysics in 1986 from the University of Houston. From 1982 until 1989, he worked at INTERVEP. He subsequently joined Technica, where he remained until 1992. Thereafter, he worked at Simon Petroleum Technology until arriving at PGS Reservoir in 1994, where he is manager of Multicomponent Processing and Interpretation, Reservoir Consultants, Houston. |
- Applying ultra-deep LWD resistivity technology successfully in a SAGD operation (May 2019)
- Adoption of wireless intelligent completions advances (May 2019)
- Majors double down as takeaway crunch eases (April 2019)
- What’s new in well logging and formation evaluation (April 2019)
- Qualification of a 20,000-psi subsea BOP: A collaborative approach (February 2019)
- ConocoPhillips’ Greg Leveille sees rapid trajectory of technical advancement continuing (February 2019)

