Changes improve OCTG outlook
SPECIAL REPORT: OCTGChanges improve OCTG outlookImproved emphasis on natural gas drilling, manufacturer consolidation, new import / distribution strategies and basically sound industry fundamentals point to improved OCTG markets for at least the near termCharles Perkins, President, Pipe Logix, Inc., Santa Fe, New Mexico
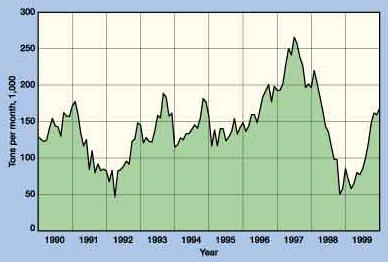
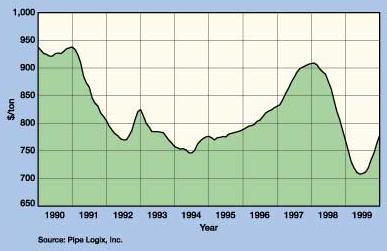
With the turnaround in crude oil prices, and with natural gas wellhead prices surviving three warm winters and moving drilling levels up, it is easy to say that the outlook for OCTG is optimistic. It is not easy to say how long it will last. Changes In Drilling And Demand In 1990, domestic crude oil production (Alaska included) averaged 9.1 MMbpd. In 1999, it averaged 6.9 MMbpd – a decrease of 24%. Natural gas and gas plant liquids production totaled 20.5 Quad Btu in 1990 and increased to 21.8 QBtu in 1999. Gas accounted for 63% of domestic hydrocarbon production in 1999. Without gas, the domestic OCTG market would have been devastated. For the OCTG industry, the most important change in the last decade was the shift to drilling for gas. This is reflected in the Baker Hughes rig count. The 1990 average was 53% of the rigs drilling for oil, vs. 47% for gas. The gas-rig ratio increased to 78% for 1999. These ratios were also reflected in wells drilled. In 1990, gas wells accounted for 47% of commercial completions, oil wells 53%. In 1999, gas wells were 72%, oil wells 28%. The shift to gas drilling is of major importance for a couple of reasons. Paramount is the fact that domestic wellhead prices for gas are largely insulated from international gas prices. Conversely, crude prices are set in a truly global market. The volatility in oil prices works against long-term economics in oil drilling. Other factors do affect gas prices, but they are still less volatile than crude prices. The shift to more gas drilling has other important meaning to the OCTG market. The key factor is that gas wells tend to be deeper (more pipe per well) and have higher pressure (requiring heavier pipe and in higher-strength grades). Department of Energy data show that the average well depth for all wells increased from 4,871 ft per well in 1990, to 5,944 ft in 1999 – a 22% increase. The last decade also brought major technology improvements in exploration, drilling and exploitation. Advances in computer-processing power facilitated efficiencies, from seismic (particularly 3-D) to reservoir development. The technological advances are reflected in the number of wells drilled as dry holes. In 1990, dry holes accounted for 26% of all wells drilled. In 1999, this was reduced to 20%. The higher success ratio is obviously good for drilling economics. To summarize, changes to gas drilling and advances in technology have made the domestic production industry viable for the new decade. Manufacturing Changes The last decade was tough for the pipe mills also. Drilling (and OCTG usage) was at low levels and cyclical. The Baker Hughes rig count reached an all time low of 488 rigs for the report dated April 23, 1999. While OCTG usage was at low levels and cyclical, demand (order placement) at the mills was even more volatile due to the inventory cycle. Fig. 1 shows the volatility in tubular shipments (including imports). They decreased from 177,645 tons in February 1991, to 42,074 t in April 1992 – a total decrease of 76% in an 15-month period. Shipments then increased to 188,793 t in September 1993 – a total increase of 349% in a 17-month period. Shipments dropped from 265,994 t in July 1997 to 46,052 t in November 1998 – a total decrease of 83% in a 17-month period. Fig. 2 shows similar volatility in OCTG spot market prices during this period.
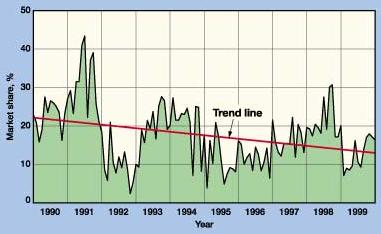
Imports also changed in the last decade. Most important for domestic mills, the trend has been to a lower import market share. And as seen in Fig. 3, there were large and rapid swings in import market share.
The U.S. is the world’s largest and most open market for OCTG. The barriers to entry are few; all the infrastructure needs are readily available from local agents and contractors. Since all of the international mills make pipe to API specs, market acceptance is usually not a problem. The result was that there were 20 countries that exported at least 10,000 t of OCTG to the U.S. market in the last decade – a large and diverse source of mills. The open U.S. market invited placement of some foreign mills’ surplus inventory and capacity. This is viewed as "dumping" by domestic mills. Successful dumping suits by domestic mills have impacted imports from some countries – Canada and Argentina are prime examples. In a reversal of roles, we now see exports coming from China, India and Russia – all former OCTG importers. The open market also allows rapid changes in imports: in April 1999, imports were 6,062 t (8% market share) and rose to 56,634 t in March 2000 (24% market share). Imports will always be a factor in the outlook for the OCTG market. In summary, the combination of overcapacity, volatile demand and variable prices forced the surviving manufacturers to become very cost-effective producers. Thus, the survivors are well positioned for the next decade. Distribution Changes As with the oil and gas operators and pipe manufacturers, there was significant consolidation in the OCTG distribution segment. The distributors experienced low volumes, low inventory turnover and low operating margins. The distributors could not do anything about aggregate volume (which is dependent on drilling) or market prices. They were forced to concentrate on inventory management and reducing operating costs and overhead, i.e., "Get lean or get out." For many distributors, this meant mergers and "restructuring." Fig. 1 shows the swings in OCTG shipments and reflects the collapse in demand in 1998. Fig. 2 shows the large swings in market prices that distributors had to deal with. Spot averages dropped from $938/t in January 1991, to $744 in June 1994 – a drop of $194, or 21%. Prices recovered to $908/t in January 1998 – an increase of $164, or 22%. But they then collapsed to $706 in May 1999 – a $202 decrease of 22%. Decreases of 21% and 22% in market prices meant a corresponding decrease in the value of distributor inventory. OCTG inventory is capital intensive. With low turnover and price deterioration, some distributors were decapitalized and left the business. The surviving distributors still face a competitive market. While spot prices have recovered, the mills have also put through badly needed increases. Stocking programs and purchasing alliances – between users and distributors – were strategies for improving inventory management in the ‘90s. As a strategy, their futures are uncertain – as are some of the new "B to B" Internet strategies. The critical factor for distributors will continue to be inventory management. The changes – newly consolidated distributors – should make for better inventory turnover than in the last decade. Outlook Fundamentals for the domestic OCTG industry are as good now as they ever were in the last decade. Tubular demand is driven by drilling for natural gas. Current (May 22, 2000) wellhead prices for gas are at high levels and are forecast to stay strong. This should provide profits to generate good net returns on investment which, in turn, should sustain the plowback of wellhead revenues to support continued increases in gas drilling. The current forecasts are for increasing natural gas consumption. A key change has been the electric power generating use of gas to meet summer air conditioning loads. This warm-weather gas use eliminates the seasonality that plagued the gas business in the past. It looks like increased drilling will be needed in the future, just to sustain current levels of gas deliverability. Gas fundamentals are solid – at current wellhead prices, it is not unreasonable to expect gas drilling, alone, to increase to a level of 800 rigs by year-end. Crude oil prices are also at high levels. Even at lower levels, wellhead revenues should support more drilling – the problem is the uncertainty of future prices. The recent run-up in crude prices was the direct result of production cutbacks by OPEC. What it clearly revealed was the fact that OPEC controlled most of the surplus oil production capacity in the world. Whether it will continue to "not cheat" on its quotas is uncertain – at least enough to keep domestic oil operators from rushing into big capital expenditure programs for oil. There is one scenario that says OPEC will have the willpower to constrain production to keep prices at the level it desires. Most of the organization’s extra production capacity is in four countries in the Persian Gulf area (Saudi Arabia, Kuwait, Iran and Iraq), where political power is concentrated. They might not like each other, but their resolve comes from their need for money. And maybe they have learned something from the history of "overproducing." The world oil supply and demand is nearer to being in balance than at any time in the last decade. Fundamentals are solid, the geopolitical factor is the wildcard. If crude prices hold at levels over $20/bbl, it is not unreasonable to expect drilling for oil to increase to 400 rigs by the end of the year. In summary, the changes of the last decade, combined with good fundamentals
for the near term, make for a promising outlook for the OCTG industry. The authorCharles A. Perkins, Jr., founder / owner of Pipe Logix, Inc. of Santa Fe, New Mexico, received a BS degree in petroleum engineering from the University of Oklahoma, and an MBA from the Harvard Business School, in 1952 and 1957, respectively. His industry experience includes three years overseas with Standard-Vacuum Oil Co., eight years with the Tubular Steel Division of A. O. Smith Corp. and seven years with the Pipe Systems Division of Ciba Geigy. He organized and founded Pipe Logix in 1974, to provide information services for the OCTG industry. Mr. Perkins has been a frequent contributor to World Oil, with his first article appearing in the February 1975 issue. |