Application of AVO and inversion to formation properties
Application of AVO and inversion to formation propertiesInversion of AVO results can be used to derive elastic rock properties that, in turn, can be used for quick determination of reservoir lithology and fluid contentDavid Gray and Eric Andersen, Veritas, Calgary, Alberta, Canada
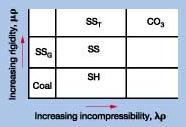
The author concludes from the discussion that rock properties can be derived from inversion of AVO stacks. These sections greatly reduce ambiguity in determining lithology and fluid content. The rewards are faster interpretation, high-graded prospects and better reservoir characterization. Introduction Inversion of AVO results may be used to derive parameters proportional to rigidity, m, and Lamé’s modulus, l.1 Rigidity, also known as shear rigidity or shear modulus, is defined as the resistance to a strain that produces a shape change without changing total volume. It is useful for distinguishing sand quality, because it is generally unaffected by reservoir fluids. Conversely, Lamé’s modulus is closely related to incompressibility and contains a higher proportion of information about formation fluid. Incompressibility, also known as bulk modulus, is the resistance to a change in volume caused by a change in pressure; it is the inverse of compressibility. Method The concepts of incompressibility and rigidity, as expressed by lr and mr, respectively – where r is the density parameter – help in understanding why AVO responses occur, because they are fundamental and simple concepts, Fig. 1. For example, different AVO responses typically observed in sandstones and carbonates can be explained as follows:
Rocks and fluids do not compress easily. However, gas does compress easily. Hence, the presence of gas in fragile, grain-supported rock, like some sandstones, causes a significant decrease in its incompressibility. Gas within rock does not affect its rigidity, so the result is a significant AVO response which depends on the contrast between incompressibility and rigidity. By comparison, the AVO response of gas-charged, carbonate rocks, like limestone, has usually been much less significant than that seen for sands, particularly gas sands. This is because gas within these rocks is rarely significantly compressed, since almost all the compressive energy of the seismic wave is transmitted through the incompressible, rigid carbonate matrix. Using the concepts of incompressibility and rigidity is useful in understanding differences in AVO responses observed in these dissimilar lithologies. Different types of lithologies tend to separate along orthogonal boundaries in a crossplot of mr vs. lr. Consequently, these two parameters may be considered independent and can be interpreted separately; whereas in combination, they provide additional information on the nature and content of the rocks and fluids from which they arise. This is a significant improvement over previous techniques for identifying gas accumulations, including crossplots of S-wave vs. P-wave velocities or Poisson’s ratio vs. P-wave velocity, where both parameters must be interpreted simultaneously. In particular, rock-property sections of lr and mr are interpreted by identifying zones of interest using one of these; the other is then used to high-grade the original interpretation. For example, zones of low incompressibility (lr) suggest the presence of gas or coal. By using additional information available from rigidity (mr), gas sands can be more-clearly distinguished from coals, because sand has high rigidity and coal has low rigidity, Fig. 2. This methodology is demonstrated in the following examples.
Both rigidity and Lamé’s modulus can be obtained from pre-stack seismic data using the method of Goodway, et al.1 Specifically, the derivable rock properties are mr and lr. Currently, the density parameter, r, is difficult to derive from AVO equations using typical seismic data.2 The method is demonstrated on a line from the Judd basin (Figs. 3 through 8) and comprises the following steps:
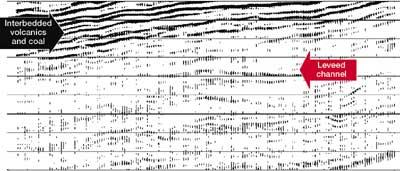
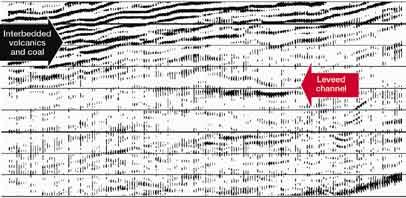
1. Estimate pure P-wave reflectivity (Fig. 3) and pure S-wave reflectivity (Fig. 4) sections from gathers using the AVO method of Gidlow, et al.3
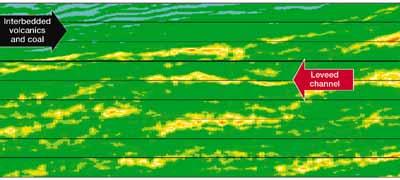
2. Invert the estimated, pure S-wave reflectivity for S-wave impedance. 3. Convert S-wave impedance to mr, Fig. 5.
4. Invert estimated pure P-wave reflectivity for P-wave impedance. 5. Use P-wave impedance and mr to calculate lr, Fig. 6.
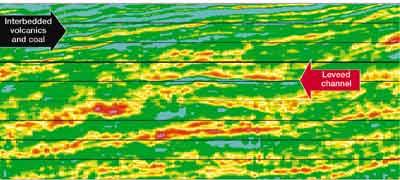
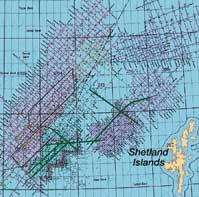
Examples Three examples of the application of this method follow. Judd basin. Figs. 3 and 4 show lr and mr marine-seismic sections from the Judd basin, Faeroe-Shetland area. This is a pure exploration play NW of the Foinaven discovery. Much of the remaining prospectivity in this region can be expected in stratigraphic closures within the Palaeogene succession.4 The inversion method for rock properties allows some estimation of stratigraphy with limited well control in this area. Development of the lr and mr sections are shown on a line from seismic streamer surveys acquired by Veritas over Judd basin, Fig. 7. The P-wave stack is extracted from this data; indicated on it is an interpreted leveed channel, Fig. 3. However, this channel does not stand out against the background amplitudes. This behavior is typical of Class II, near-zero impedance sands.5
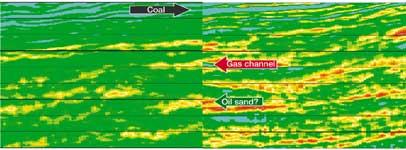
The S-wave stack extracted from this data shows strong amplitudes at the leveed location. It is unaffected by fluid content and provides stronger evidence for the presence of a more-rigid sand body, Fig. 4. Further evidence for existence of a sand body is provided by relatively high values in the mr (rigidity) section seen at this location, Fig. 5. These high values indicate that the S-wave anomaly is indeed associated with a rigidity increase and is likely indicating the presence of sand. At the same location, the lr section has very low values, indicating the possibility of gas. Referring to the interpretation chart (Fig. 2), by combining these two pieces of information, it is seen that these responses are likely due to gas-filled sand. The greatest benefit of the Lambda- and Mu-Rho (LMR) technique is that having to crossplot the data becomes unnecessary.1 This is because the various fluids and lithologies separate along roughly orthogonal boundaries in a mr vs. lr crossplot, which means they are very nearly independent and, therefore, can be interpreted separately and the results combined. These benefits are demonstrated by interpreting mr and lr sections laid side-by-side, Fig. 8. Note that no P-wave to S-wave correlation is necessary, because the S-wave information is generated in P-wave time, since it is derived from P-wave gathers. So, the lr and mr sections align in time by design. This is a benefit when compared to multicomponent seismic data, where extensive interpretation must be done first to align the seismic data derived from P-wave and S-wave propagation modes.
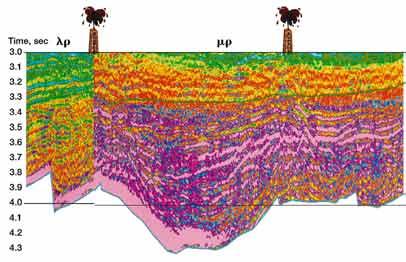
More important, interpretation of the lr and mr data can be done quickly in this way. First, the high values of mr are used to indicate potential sand zones; then, these potential sands can be qualified for gas presence by looking for low lr values at the same location. Since these attributes are independent, this process can be reversed by looking for low values of lr first, which indicate potential gas, and then associating these low values with high mr values, which tend to indicate higher probabilities of sand bodies. In the first Judd basin example, coals are interpreted in the shallow section from low values of both lr and mr, confirming the expectation of coals interbedded with Faeroese volcanics. A gas-filled, leveed sand channel is interpreted in the middle of the section from the high values of mr (indicating a potential sand accumulation) and low values of lr (indicating a potential gas accumulation), thus signifying a good probability that hydrocarbons have migrated into this area. There are several other zones of high mr, both above and below the interpreted gas-filled channel, that indicate possible sand bodies. However, these are also associated with higher values of lr. Consequently, since there is a strong indication of hydrocarbon migration in the interpreted gas-filled channel, it can be surmised that these potential sands may be oil filled and, therefore, worth testing. A second line from the streamer survey indicates gas responses at the location of Well 27-1 (left well of Fig. 9), which had gas shows at 3.3, 3.4 and 3.5 – 3.6 sec. There are low lr values associated with high mr values in these sections that are likely related to gas observed in the well. Between the wells, based on low lr values combined with high mr values, there is strong evidence for a large gas accumulation at about 3.5 sec, as can be seen in Fig. 10.
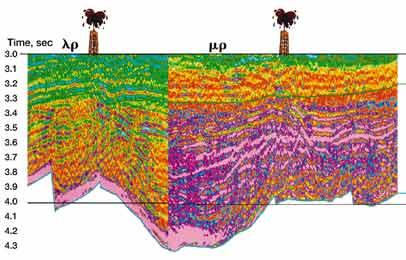
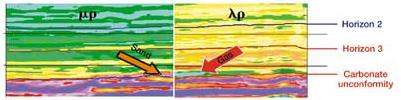
Western Canadian basin. Fig. 11 shows sections of lr and mr in a fluvial-clastic section over a carbonate unconformity in the Western Canadian basin.6 Two proven gas sands are seen as low-lr (incompressibility) zones, while the carbonate unconformity is clearly seen as a change from low to high values of lr. Combining interpretation of the lr section with interpretation of the mr section increases confidence that these anomalies are associated with sands. The relatively high values of mr indicate that these are likely clean gas sands, as proven by drilling.
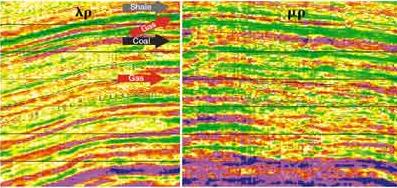
China gas field. Fig. 12 shows an example combining an existing field development with deeper exploration in a mainland China gas field. This section comprises lacustrine and channel environments and is known to contain shale, coal, tight sands and gas sands. Here, interpreting lr alone is insufficient to indicate the presence of gas sands, because both coal and gas sands have low values of lr. However, large areas of low values of lr indicate the potential for extensive gas sands.
Furthermore, higher values of
mr indicate the possibility of sands but cannot distinguish their fluid content.
Indeed, combining lr with mr indicates the presence of
gas sands at drilled locations, while there are several zones of low lr associated
with high mr deeper in the section, corresponding to potential exploration
targets. Acknowledgment The authors thank: Veritas, PanCanadian, Mr. Wang and Mr. Deng for permission to publish this data; Mr. Wang, Mr. Wang Sr., Mr. Deng and their staff for assistance in interpreting the China data; Bill Goodway, Nanxun Dai, Taiwen Chen, Diane Lynnes, Kim Head, Steve Toothill, Rick Ogloff, Jim Martin, Hart Janssen and Paul Parsoneau for their assistance in interpreting and generating this data; and Helmut Jakubowicz for his detailed review and suggestions. Literature Cited Note: A more complete set of references is available from the authors upon request.
The authors
Eric Andersen graduated from the University of Alberta in 1983 with a BSc in Mathematics. After graduation, he supervised a wireline truck and worked in cased-hole well logging, completions and pipe recovery in northern Alberta. In 1986, he returned to the University of Alberta to earn a BSc in geophysics. He joined Veritas in 1990 and, after managing various departments and business units, now manages Business Development and Attribute Analysis for Veritas Exploration Services, Calgary. Eric has over 13 years experience in Canada’s oil and gas business. He is a member of CSEG, SEG, CSPG, SPE and APEGGA. |

 David
Gray earned a BSc in honors geophysics from the University of Western
Ontario in 1984 and an MS in mathematics, statistics, from the University of Waterloo in 1989. He joined
Veritas in 1988 were he has held positions as processor, AVO specialist and research programmer. He is
currently a research geophysicist specializing in AVO applications for Veritas Exploration Services, a new
company based in Calgary.
David
Gray earned a BSc in honors geophysics from the University of Western
Ontario in 1984 and an MS in mathematics, statistics, from the University of Waterloo in 1989. He joined
Veritas in 1988 were he has held positions as processor, AVO specialist and research programmer. He is
currently a research geophysicist specializing in AVO applications for Veritas Exploration Services, a new
company based in Calgary.
