TECHNOLOGY AT WORK: New products and R&D solve operating problems
TECHNOLOGY AT WORKNew products and R&D solve operating problems
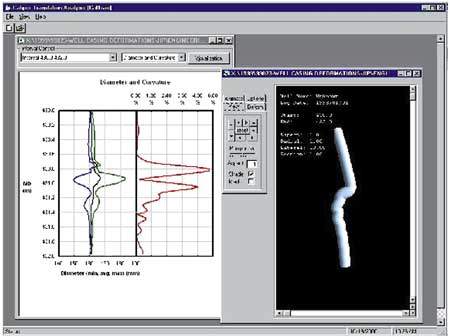
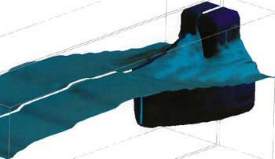
Evaluating casing deformationBrian Wagg and Cam Matthews, C-FER Technologies Rig reports are usually very explicit, e.g., "casing collapsed at 2,478 m KB." But is the casing really "collapsed," or has the pipe been deformed by some other mechanism? Field experience has shown that common casing failure events that are initially blamed on collapse can often be due to other deformation mechanisms, such as lateral shear, buckling and tension. Understanding the mechanisms responsible for casing deformation is critical to the immediate need of repairing the damaged well, but also to the longer-term need for understanding the level of risk for similar failures in other existing wells. This knowledge is also important in evaluating and selecting appropriate drilling / completion designs for new wells. C-FER Technologies of Edmonton, Alberta, Canada, uses data from casedhole, multisensor-caliper logs to characterize deformed-well shapes. By comparing the deformed-well shape to finite element models of the interaction between casing and surrounding formations, the formation movements and underlying geotechnical mechanisms that contributed to the failure can be inferred. An example is described later. Multisensor-caliper log interpretation. The first step in interpreting casing deformations is to collect detailed data describing the deformed-well shape. This is accomplished with a multisensor-caliper tool, by which the inside-casing radius is reported for each individual arm. Typical caliper tools have 40 or 60 arms and can log casing sizes ranging from 100 mm to 245 mm (4 in. to 9-5/8 in.). Special adapter packages have also been developed to log casing inside diameters (IDs) up to about 500 mm (20 in.). Given the geometry and measurement precision of the multisensor-caliper tool, this equipment provides the ability to detect changes in the trajectory of a well axis of as small as 0.01°. In typical surveys, a reading of each individual arm is recorded every 25 mm (1 in.) as the tool travels up the wellbore. This resolution is sufficient to detect lateral displacements of the casing axis across discrete weakness planes such as bedding planes or unconformities. The multisensor-caliper tool also indicates which of the sensing arms is closest to the "up" direction. Therefore, by combining this "tool orientation" information with measurements of the casing ID, the complete 3-D shape of the casing – including bends and twists of the casing axis – can be generated. C-FER has developed the software package CalTran to process the raw caliper-log data and describe the casing shape, Fig. 1. This includes a series of plots showing changes in parameters such as ovality, minimum / average / maximum casing ID and the wellbore trajectories in both plan and cross-section views. In addition, the software uses the information on local casing curvatures to calculate flexural strain imposed on the casing to indicate the level of mechanical damage incurred. Drift diameter is also calculated to indicate how the combination of well-axis curvature and casing ovality combine to reduce effective well diameter for running tools or liners.
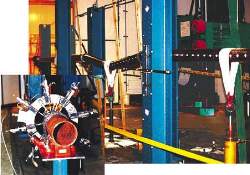
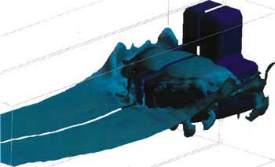
The mathematical algorithms at the heart of the CalTran software were verified through full-scale lab testing in which the actual logging tool was run repeatedly through a section of casing that was progressively deformed using a system of hydraulic rams, Fig. 2. Casing shape and trajectory predicted by CalTran algorithms were compared to physical measurements to verify that CalTran generated an accurate representation of the deformed casing.
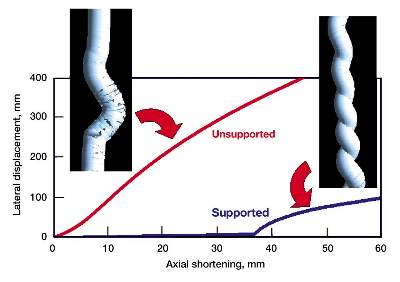
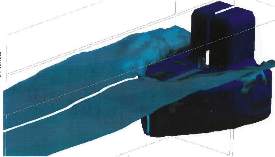
CalTran also provides an animated, 3-D model of the casing so the user can visualize how changes in casing ovality and well-axis trajectory combine to tell the story of how the casing was deformed. In many instances, more than one deformation mechanism is evident once the overall well shape can be examined. Magnification can be applied to various aspects of the casing shape to enhance different features; and different casing intervals can be viewed from different perspectives to allow a complete string inspection. Casing / formation interaction. Once the shape of the deformed wellbore is established with the CalTran interpretation of multisensor-caliper log data, a number of hypotheses can usually be generated to explain how the deformation occurred. In most cases, these hypotheses comprise combinations of four basic deformation mechanisms: collapse, shear, buckling and tension. The questions then become – which mechanism has occurred and what is the root cause that initiated it? These questions are answered using finite-element analysis techniques to model the interaction between casing, annulus cement and surrounding formation. Accurate mechanical models of casing, cement and formation materials are critical to these simulations – especially the post-yield performance, since most casing problems include deformations well in excess of the elastic behavior of the materials involved. In many instances, time-dependent (creep), high-temperature or dynamic material properties are also required to investigate certain deformation mechanisms. In many cases, one or more of the deformation mechanisms can be eliminated immediately, simply because the deformed well shape does not resemble the shape expected from that particular mechanism. The remaining mechanisms are tested by simulating them with casing / formation-interaction models, Fig. 3. The magnitude of the deformations is manipulated in the models in an attempt to match the well shape defined by the multisensor-caliper data. If the well shape cannot be matched within the bounds of what are judged to be reasonable displacements, other deformation mechanisms or combination of different mechanisms are investigated.
Generally, these analyses point to a deformation mechanism or, possibly, a loading history of different mechanisms that provides a reasonable explanation for the deformations. Once the deformation mechanism has been established, the analysis can focus on the root cause. This usually involves analysis of geotechnical processes in the reservoir and overburden such as reservoir compaction, subsidence, thermal expansion / contraction and movement along weakness planes. Subsurface process monitoring. The link between casing shape and processes occurring in the surrounding formations opens the possibility of using this technique as a monitoring tool to collect important information on the downhole environment. Intermittent surveys in operating wells could be used to map progressive movement along shear planes or to infer reservoir compaction based on the casing’s buckling behavior. In fields with a history of casing-related problems, it might be possible to reconstruct progression of the deformations over time by logging wells of different ages and comparing the magnitude of deformation features. Applications. The technique of analyzing casing deformations using CalTran was first developed to investigate casing deformations due to compaction of North Sea chalk reservoirs. These analyses showed buckling in the reservoir accompanied by shear deformations in the overburden. Analyses of wells encountering shallow-water flow zones in the Gulf of Mexico showed both Euler and helical buckling, with shear superimposed in some cases. More than 400 logs have been run in Canada’s thermal, heavy-oil developments to monitor casing shear and slotted-liner deformations. The referenced paper by Wagg et al describes earlier tests of the CalTran system in one heavy oil operation.1 Outside the petroleum industry, this technique is included in a proposal to monitor movement along known, subsurface tectonic faults. The analysis of heavy oil wells producing massive quantities of sand on primary production provides an example of how well deformations may be used to infer reservoir processes. The problem wells had produced on the order of 1,000 m3 of sand in just two years of production. Well operators reported increased rod / tubing wear rates just above the producing interval, followed by instances of progressing cavity pump rotors suffering fatigue failures after as little as one month of service. Multisensor-caliper logs processed using CalTran showed lateral displacements of the casing over the 10-m reservoir interval of up to 200 mm (8 in.). Finite-element modeling of the casing / formation interaction included the effects of pressure depletion, sand removal and lateral formation movements. The analysis showed that the most likely deformation mechanism was shortening of the reservoir interval by a combination of overburden subsidence and underburden upthrust due to the production of massive quantities of sand. Sand production also removed lateral support for the casing, allowing it to form an Euler buckle. By comparing magnitude / shape of the Euler buckle measured in the field with predictions from the finite-element models, it was concluded that about 25 mm (1 in.) of shortening over the reservoir interval must have occurred. This magnitude of shortening was then used to benchmark geotechnical models that specified the shape of the zone contributing sand to the well. The final result was a model of an elongated zone of sand production that fit both casing-deformation criteria and field-tracer tests which indicated elongated sand-production zones that interconnect wells. With the knowledge of the magnitude and type of deformations being
encountered, the operating company was able to investigate different techniques for repairing the wells,
reducing damage in existing wells and redesigning new wells to accommodate the type of formation movements
indicated by the analysis.
Literature Cited
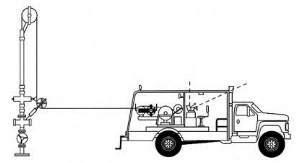
Testing stainless steels for critical downhole wireline applicationsThis article overviews comprehensive testing done by Sandvik Steel on stainless steel alloys used in slickline / wireline operations in corrosive downhole environments. It summarizes comprehensive data presented in the report by Bertil Walden and Charlotte Ulfvin of AB Sandvik Steel’s R&D Centre titled High alloyed stainless steel wire for heavy duty slickline / wireline operations. That 9-page report features 18 figures, three tables, four references (as noted in the Literature Cited), plus more detailed narrative discussions. Background. Corrosion-resistant alloys are widely used in oil / gas production. This is particularly true when the fluids are sour as a result of high CO2 and H2S concentrations and / or when chloride concentrations and temperatures are high. For critical applications such as wirelines, downhole components, production tubulars, piping systems and subsea systems, the material selected is normally a result of careful evaluations, where factors such as availability, technical requirements and life cycle cost form the basis for final selection. Still, the process can be optimized by using the right data provided by material producers. One area where material selection is of great importance is for wireline applications such as slickline and also, in some respects, for logging cables. Here is found one of the toughest applications, where material limits are stretched to the absolute maximum. The consequences of an eventual failure are enormous, as this will result in immediate production loss, and time-consuming fishing. It is, therefore, important to have data that will improve the possibility of selecting the right material. In the report, summarized here, requirements set by the application are discussed; and new tests are reported, in combination with old results reported earlier. Application requirements. From the mechanical perspective, a wireline operation puts certain requirements on the material, which can be understood by analyzing the application. In the accompanying figure representing a typical wireline rig, the wire goes from a service coil through a wheel counter, via the wheel up to a pulley wheel and then through the stuffing box into the well.
Maximum loads are normally limited to 60 – 75% of wire breaking strength following recommendations by manufacturers. This is governed by a tension controller, meaning equipment normally cannot pull loads higher than those programed, without a special purpose, and probably not without special permission. Loads consist normally of the wire itself and addition of weights such as tools. In the worst case, if something is stuck, pulling force is set by maximum load recommendations. An example calculation assumes a 25,000-ft (7,600-m) line with 1,500-MPa tensile strength, 185,000-MPa elastic modulus and 75% recommended safe load. For the worst case, simulating a jarring application at 25,000 ft with a 0.125-in. line, elongation induced by maximum pulling force = 70 ft (21 m), meaning an additional 21 m are spooled on the service reel. This means stresses are coming both from weight / pulling forces and bending forces influenced by pulley-wheel diameter. The calculation indicates a constant plastic strain is induced at the outer fiber. And the mechanism of failure is most likely strain-induced fatigue. Downhole requirements. In a well, the wire is normally under the load of the recommended maximum stress. Because of heterogeneities on the wire, it is reasonable to assume that stress concentration occurs and that stresses up to the yield strength are present. Fluids in the wells are normally oil / gas / water polluted by sour gases such as CO2 and H2S and / or chlorides. This means that an improper selection might lead to corrosion of the materials. Two corrosion mechanisms might occur in the well fluid – chloride-induced corrosion or H2S-induced corrosion. As conditions vary from well to well, the optimum material selection is a function of cost and resistance against well fluids and mechanical loads. Stainless steel wirelines. Sandvik has several wirelines in its product program, each with specific properties. Relevant grades are shown in the accompanying table. Stainless steels are dependent on the oxide layer formed by the reaction of chromium and oxygen from the environment the material is working in. This means a material with higher chromium concentration will have a better corrosion resistance – as a general rule of thumb. Thus, optimum material selection must take into account specific environmental conditions, in combination with material cost. The most important properties of the listed steels in various environments are overviewed below. Chloride corrosion. In most well environments, chlorides are present, mainly from the formation water. In certain high-pressure, high-temperature wells, concentrations up to 25% can be reached. In such wells, with little or very low concentrations of sour gases, chloride-induced corrosion is the main mechanism of concern. There are two types of chloride corrosion: pitting and stress-corrosion cracking (SSC). Pitting corrosion is categorized by local attacks of narrow extension, most often with a significant depth. It occurs on stainless steels and other alloys where corrosion resistance depends on the stability of passive film in neutral or acidic solutions where halide ions are present. The main reason for this attack is the ability of the halide ion to break down the passive film at weak spots such as grain boundaries, slag inclusions or other heterogeneities. The spot where the passive film has broken down will then act as an anode – the remaining part of the surface as a cathode. This leads to a small cathode / anode ratio, giving very high current density in the pit and, therefore, a high propagation rate. The risk is accentuated by increased temperature, halide ion concentration, and redox potential (oxygen content or presence of oxidizing species). High concentrations of chromium, molybdenum and nitrogen are beneficial. To simulate different environments, tests are made in electrochemical cells containing an electrolyte. The potential can then be fixed to a level simulating the actual environment. The temperature where the sample exhibits pitting is determined as the critical pitting temperature (CPT). Tests made with higher corrosion potentials are useful in ranking various alloys against each other. Chloride-induced, stress-corrosion cracking. In all constructions, stress levels up to the yield strength are present. This is certainly valid for wirelines operating downhole. This, in combination with chlorides, leads to a risk of stress corrosion cracking (SCC). Standard austenitic steels are prone to SCC at temperatures exceeding 60°C (140°F). Resistance of austenitic stainless steels increases with increasing Ni content. Conversely, duplex stainless steels have an extremely high resistance, even if the nickel content is considerably lower. According to the most common theory, this is due to protection of the austenite by the ferrite. In austenitic steels, an increased Ni content, together with increased stability against pitting corrosion, will lead to a higher resistance to SCC. This is explained by the resistance to the formation of martensite with increasing Ni content. Available data from the SCC tests in aerated solutions are presented in the complete report. Corrosion in sour environments. In the long term, there will be a need for deeper oil and gas wells. These wells are normally of higher temperature and, more important, have higher concentrations of sour gases. Formation waters often contain chlorides that, together with H2S, accelerate the fluids’ aggressiveness. In O2-free environments, H2S reduces the ability of CRA to passivate. At the same time, it promotes absorbed hydrogen entering the material, and H2 embrittlement can take place. This is why the most significant corrosion type of CRA in sour environments is cracking, leading to unpredictable and costly failures. Sandvik has performed thorough work in this area to get data about the materials in various environmental conditions. It has been reported elsewhere that the most important parameters influencing sour corrosion are partial pressure of H2S, pH, concentration of chlorides and temperature.1 Influence of Cl content and pH. In modified NACE-type tests, tensile specimens from cold-worked material2 of SAF 2205 and Sanicro 28 were tested in the NACE type of environment, but with the modification that the temperature was increased to 90°C (194°F). The specimens were stressed to 0.2 yield strength at testing temperature using constant load, and the testing time was 500 hr. The concentration of NaCl was varied up to 10%. Further tests were made in the same environments as above, but with a pH of 3.9 instead of 2.5. By not adding the acetic acid specified by NACE, a drastic effect on the resistance was seen. High-pressure-autoclave tests. These have been designed and performed for use up to 260°C (500°F). In the autoclaves, the specimens were fully exposed to an aqueous solution which was overpressured to a gas phase containing different proportions of H2S/CO2/CH4. The test solutions were prepared with chlorides added (reagent grade and distilled water). The liquid was then purged with N2 to reduce dissolved O2. Results indicate Sanicro 28 is fully resistant to partial pressures of H2S above 220 psi up to 140°C (285°F). Between 140°C and 260°C, it was resistant at sodium chloride content of 5%, up to partial pressures of 220 psi. When NaCl concentration was increased to 15%, results indicate SCC might occur. Influence of alloy composition. The influence of the various alloying elements on H2S resistance has been greatly debated. Some work has been performed3 which indicates high Cr and Ni content is most important. C-rings loaded to the yield point at room temperature and U-bends were used; Sanicro 28 was the only resistant alloy in the test. Results indicated the combined effect of Cr + Ni content is more important than a high Mo content when it comes to SCC resistance in deaerated H2S/Cl environments. More work has been done supporting the findings of Vaughn et al.,4 which investigated performance of different alloys in field environments and lab conditions. Interestingly, it was found that low-alloyed stainless steels exhibited pitting and chloride-induced, stress-corrosion cracking in the environments, while for the higher-alloyed materials, the failure mechanism was H2S-induced, stress-corrosion cracking. It was suggested that materials suitable for wireline service in H2S-containing environments needed a Ni content above 30%. Development work. Based on the review of available data presented above, one can draw the conclusion that a careful material selection based on actual field data must be made, as optimum material selection is a function of cost, strength and corrosion resistance. It is clear that a wide range of well conditions can be covered by the existing program. From the analysis of the mechanical requirements of the wire it is, however, evident that there is a need for a high-strength alloy. Material from a standard Sanicro 28 was remelted in the lab furnace with varying N-content to improve the strength. Based on positive results from the investigations, a heat was ordered with 0.125%N. The material was hot rolled into wire rod and then wirelines were drawn. The wire was investigated both with regard to surfaces and metallographic structure. It was then tested in a rig simulating conditions during a jarring operation. As referenced, the standard version of Sanicro 28 was tested, together with the newly developed Sanicro 26 Mo. A load of 193 kg was applied, and the wirelines were pulled over a wheel diameter of 17.8 cm. From the results, it is clear that the modern alloys have excellent properties from both mechanical and corrosion points of view. It is worthwhile to note the drastic reduction on the number of cycles to failure when increasing wire dimension to 0.125 in. from 0.092 in. In conclusion, Sandvik has made thorough material investigations to simulate
its products intended for oil / gas service. It has been shown that the materials available are expected to
perform reliably in field service.
Literature Cited
Computer simulations analyze wave damage to offloading vesselsCharles Ortloff, Manager, Numerical Simulation Department, CTC/United Defense, Santa Clara, California Computer simulation is beginning to play a major role in analyzing floating production / storage / offloading (FPSO) vessel damage in typhoons and other storms. Prediction of transient loads resulting from green-water impact on FPSO hull and deck structures has traditionally been determined solely by scale-model tests. However, physical tests are expensive, and methods currently used to scale up test results leave a lot to be desired, particularly for deepwater applications. That is the main reason why computational fluid dynamics (CFD), a numerical method that solves fluid-flow equations, is increasingly being used to simulate green-water impact. CFD has already been demonstrated to be capable of accurately predicting transient loads on FPSO hull and deck structures. Advantages include the fact that it is less expensive, and it eliminates scaling difficulties associated with physical tests. Additionally, wave speed / length / period relationships for deep- and shallow-water applications, as well as wave shapes, can be prescribed as input. FPSOs hold their position through use of computer-controlled thrusters or anchoring, and can operate in various water depths. Currently, there are about 85 FPSOs in the worldwide fleet, either operating or under construction – up from about one-third of that only five years ago. Green-water impact. One of the most critical issues in FPSO design is their ability to withstand green-water impact without damage. Green water, defined as water coming onto the deck of a ship in large waves, is the most common cause of damage to vessels in the U.S. Navy. On an FPSO, green water can damage sensitive on-deck equipment such as piping, the turret structure and hatch structures. While FPSOs are mobile enough to move out of the path of a storm, if given enough warning, typhoons can rise up suddenly. For example, in 1996, Typhoon Sally passed within 10 nautical miles of the Liuhua FPSO, generating waves 88-ft high and winds of 112 mph – conditions that are associated with a 200-yr event. Liuhua successfully weathered this super typhoon – with only minimal damage to pipe insulation, antennas, windows, etc. – due to its conservative design. Physical testing has long been the only method available to determine loadings resulting from green-water impacts. Test tanks are constructed, and artificial waves are crashed against a small model structure representing the hull. A typical test tank might be one-quarter acre in size, resulting in a substantial construction expense. Testing a different hull design in waters of different depths would require expensive modifications due to depth-related wave-speed and wave-length relationships. But the biggest problem with physical testing is the issue of scaling. It is generally accepted that scale effects in the absence of waves follow Froude scaling. However, on-deck flows following the moment of high-velocity impact and post-impact flows – which contain sprays and thin sheets of runoff – are likely to be affected by different scale factors, or governed by empirical correlations to relate models to full-scale transient forces. Concern exists that scaling effects may render many existing physical-model test results inaccurate. To compensate for this uncertainty, vessels are often constructed with larger-than-necessary margins of safety, which increases their cost. Usefulness of CFD. In an effort to overcome these problems, researchers at CTC / United Defense have, over the last several years, worked to develop a capability to simulate green-water impact on an FPSO with CFD analysis methods. This involves solution of the governing equations for fluid flow at millions of discrete points within a computational grid in the 3-D flow domain. For this work, it was central to have a method that could model the free-surface development of a green-water wave in its fullest complexity. FLOW-3D * from Flow Science, Inc., Los Alamos, New Mexico – which uses the volume-of-fluid (VOF) method to predict free-surface fluid motions – incorporates surface tension, turbulence models and other flow complexities necessary to describe the free-surface-flow pattern development. In particular, this code provides algorithms that track sharp liquid interfaces through large deformations and applies the correct normal and tangential-stress boundary conditions – a feature that distinguishes it from other CFD programs. This makes it possible to track separated "blobs" of fluid, as well as air bubble entrainment effects – generated after a wave impact – that have an important effect on total pressure / viscous forces exerted on the vessel. When properly validated, a CFD analysis allows engineers to obtain transient flow velocities and pressures at any location in the problem domain. This is far more information than can be obtained from test tanks, and it brings far more useful information to bear on the design process. The geometry of the vessel, depth of water, size of wave, wave speed and period, or any other condition can be changed quickly on the computer and re-analyzed to determine effect of the change. Most important, scaling is not an issue with CFD, because the simulation can easily be performed at actual size. Of course, simulation is not a substitute for testing, but rather a useful tool that, once validated, can reproduce conditions that would be impossible or impractical to duplicate in the test tank. Simulation example. In one recent example, CTC researchers constructed a solid model of a 160,000-dwt FPSO hull and transferred it to FLOW-3D as a fluid-flow obstacle. To ensure a hydrodynamically smooth outer surface, the hull was created using ANSYS methods with 60,000 tetrahedral elements. The entire fluid-plus-solid domain consisted of a 600,000-active-cell, 3-D mesh. A scaled-geometry rectangular structure was created on top of the hull with height, width and location similar to an instrumented test wall used in a corresponding physical-model test. Code was developed to simulate hull pitching frequency / amplitude that match the motion derived from test instruments. Heave and surge effects were incorporated into the code but not applied to the current calculations. The phase angle between wave and hull was set so that maximum up-pitch corresponded to the crest impacting the bow. Near the tanker bow, the computational grid size was refined to more accurately capture fluid interactions with the hull. CFD simulations were performed to study green-water behavior in three basic stages: 1) a large increase in relative wave elevation at the bow; 2) a large volume of water separating from the wave and flowing aftward on the foredeck with increasing speed due to bow-up pitch accelerations; and 3) high-velocity flow impacting the deck bridge structure. There were striking similarities between flow behavior seen in the simulation and that shown in a photo sequence from the physical-model test.
At the start of the simulation, some water remains on the deck from the previous wave cycle, which also transmitted minor disturbances to the next incoming wave. At one-sec. time, the wave crest approaches above the deck; between the 3- and 4-sec. mark, pitch motion is near a maximum and the wall of water begins to overflow the deck. At 4 sec. into the simulation, a large volume of water is shooting down the foredeck. Both simulation and test photos show a distinct, three-tiered surface overflow side pattern just ahead of the bridge between 3.5 and 4.5 sec. Near the 4.5-sec. point, water has contacted the deck structure while the reflected wave pattern propagates radially outward from the bow. By 6 sec. into the simulation, the deck is completely enveloped in water. In general, there is a somewhat larger quantity of on-deck water in the simulation than in the tests. The exclusion of heave in the simulation, as well as size differences between model and full-size hull, may explain this difference. Between 7 and 8.5 sec., deflected water is flowing off the sides of the up-pitched deck, which is consistent with test photos. After maximum water height on the deck structure is reached, runoff of the accumulated deck water begins. From 13 to 17 sec., the disturbances created by deck runoff can be seen, as well as buildup of the next crest wave. CFD was also used to predict lateral-force coefficients for a 1:82.5-scale model of a 200,000-dwt tanker. Computations were performed for a fully loaded vessel, with a conventional bow shape, at various angles of attack and water depths. In general, there was a good agreement between computations and test data. The technique shows great promise for improving detailed knowledge of design loads for FPSOs and other structures subject to severe wave and current loading, and it will prove valuable for fatigue / stress-analysis safety qualification of FPSOs in the future. Results of sample analyses indicate CFD methods can provide information that cannot be obtained from scale-model testing. In some cases, the computations provide insight into details of the flow field not available from tests due to technical limitations of test probes and the limited number of probes that can be placed in a flow field. CFD also has the potential to identify scale parameters for conversion of test
data to prototype results by providing solutions for both model and full-scale structures. In the future,
while testing will continue to play an important role, there will be an increasing shift to the use of
test-verified CFD runs as a design tool (particularly as computer speed and capacity increase) resulting in
more-accurate simulations. Flow Science, Inc.’s website is: www.flow3d.com.
Stripper well consortium establishedE. Lance Cole, Petroleum Technology Transfer Council; and Gary Covatch, DOE National Energy Technology Lab DOE’s Strategic Center for Natural Gas and the National Petroleum Technology Office at the National Energy Technology Laboratory have partnered with The Pennsylvania State University and the University of Tulsa to establish a national, industry-driven consortium that is focused on improving the production performance of domestic petroleum and gas stripper wells. The aim is to achieve improved results through collaborative efforts in identifying and funding small R&D projects. DOE will provide up to $3.0 million over three years – to be matched with a 30% cost share, or $1.3 million from industry – to fund projects selected by the consortium. One must be a member to propose an R&D project to the consortium. The consortium is actively soliciting members from industry, academia, and trade and state organizations. Annual membership fees will primarily cover consortium administrative costs. Full membership is available to any industrial or academic member for an annual fee of $1,000. Full members can: 1) steer research into areas of strategic importance to their companies; 2) submit R&D proposals, individually or jointly; and 3) gain access to low-cost technology transfer. Members retain a five-year confidentiality period. Affiliate memberships are also available for state and trade organizations. Affiliate members are entitled to attend meetings that they may summarize for their organizations. Affiliate membership is available for $200 annually. Rationale behind consortium. Low-volume oil and gas stripper wells often have unique technology and economic concerns. The driving force is large – more than half of the onshore natural gas wells in the lower 48 states are classified as strippers. More than 30,000 have been added in the last seven years, and the problem is equally large on the oil side. One key to keeping these wells contributing to domestic production is to identify projects that government and industry can co-fund to improve their performance – projects that recognize the constraints of stripper-well operation. Many of these wells are operated by smaller independents. For them, the consortium approach effectively leverages both their time and money. Together, they are a large-enough group to draw needed attention from the technology-developing community. Model projects selected by industry members have proven effective in larger consortia, such as the Drilling Engineering Association and the Completion Engineering Association. As results become available, the focused, low-cost technology-transfer effort will help them quickly apply results to their operations. Program focus and organization. The consortium has identified three special interest areas in which R&D projects will be funded: reservoir remediation, wellbore cleanup and surface-system optimization issues. Although these areas will be the primary focuses, the consortium will also consider other project proposals that target well-performance issues. The consortium will be organized to meet its membership needs. Each full member appoints one representative to an advisory committee that serves as a steering committee. The advisory committee is responsible for electing an executive council that evaluates and selects research initiatives for funding. Proposals must address improving production performance of stripper wells and must provide significant cost share. The process of having industry develop, review and select projects for funding will ensure that the consortium conducts relevant and timely research. Co-funding of projects using external sources of funding will be sought to ensure that the organization’s funds are highly leveraged. Project is moving quickly. The consortium is currently being developed. The first organizational meeting will be held in early December to introduce the consortium; members will elect an executive council to serve as the proposal-review committee. Requests for proposals will then be sent out to the group’s membership in late December and will be due in early February 2001. The consortium is planning its first proposal-review meeting in early March, where the executive council will select projects for funding. Members seeking funding will be required to make a brief 10 to 15-minute proposal to the membership, and they will be asked to submit a brief 5 to 7-page proposal. A web site will be developed in which members can electronically download standardized forms for proposal submissions, reporting requirements, and intellectual and properties guidelines. For your voice to be heard, you must move quickly. For further information or
a membership application form, contact Joel L. Morrison, The Pennsylvania State University, at: (814) 865-4802
or jlm9@psu.edu. PTTC will monitor and report consortium activities and cooperate wherever possible in
transferring project findings and insights to industry.
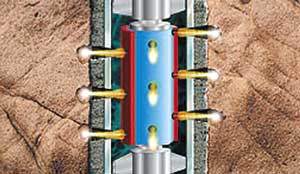
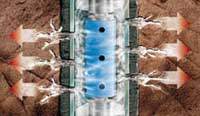
Self-stimulating perforator enhances frac jobPetromet Resources Ltd., Calgary, Alberta, a Canadian oil / gas producer, approached Canadian Completion Services (CPS) for a recommendation on a well completion in the foothills of the Rocky Mountains in Western Alberta. The result was successful application of Stimgun* technology, which improved hydraulic fracturing in a difficult stimulation application. Problem formation. The Cadomin formation has been historically difficult to produce. Tectonic stresses in the foothills of the Rocky Mountains in this area can create problems with tortuosity and premature screenouts. The formation requires hydraulic fracturing to be economically viable. In many cases – as a pretreatment – a process called extreme overbalance perforating (EOB) has been used to breakdown the perforations and initiate the fractures. This technique uses a column of nitrogen and a small amount of liquid in the tubing pressured to greater than formation frac gradient. When the perforating gun fires, the fluid and nitrogen rush toward the formation at a very high velocity, surging open all the perforations and initiating a small fracture. However, in the subject well, the Wild River 6-20, existing perforations above the zone of interest made the EOB technique impractical. Recommended solution. With limitations of the previous technique in mind, CPS recommended Stimgun as an alternate method to achieve formation breakdown. This is a process licensed from Marathon Oil Co. that involves use of an oxidizer, potassium perchlorate, molded into a tube fitted over the perforating gun as illustrated in Fig. 1. When bound with a resin, the potassium perchlorate is known as a propellant.
When the gun detonates, heat and shock ignites the propellant sleeve, generating huge volumes of CO2 at high pressures. The hydrostatic pressure of the fluid in the wellbore directs the bulk of the gas into the perforations, Fig. 2. This gas pulse can generate pressures as high as 27,000 psi for 10 to 15 milliseconds. The result is, in most cases, instantaneous perforation breakdown and fracture initiation near the wellbore. The spent gas can then be used to flow back debris from immediately around the wellbore.
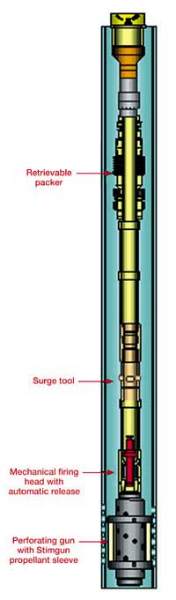
Wild River 6-20 case history. What was unique about the Petromet job was the fact that the new technique was combined with underbalanced tubing-conveyed perforating to enhance well results. The assembly was run as shown in Fig. 3. A surge tool was used to keep a predetermined fluid level in the tubing to create a 3,000-psi drawdown on the formation. Once the bottomhole assembly was logged into position, the packer set and the wellhead installed, a firing bar was dropped to detonate the gun. The bar also broke a glass disc in the surge tool, allowing communication between tubing and annulus below the packer.
When the gun fired, the propellant ignited as described, surging the perforations and initiating a bi-wing fracture. Once the initial surge from the gun sleeve had dissipated, high underbalance pressure from the reservoir backsurged into the wellbore, helping further clean up near-wellbore perforating and drilling damage. A split second later, the gun disconnected itself from the bottomhole assembly, leaving fullbore tubing for the hydraulic fracture. The end result of the treatment on this well was a near-classic hydraulic fracture. Typically, breakdown pressures in this field may exceed formation frac gradient by 3,000 to 4,000 psi before the formation breaks and the actual hydraulic fracture begins. In the subject well, no formation break was noted; sand was pumped into the
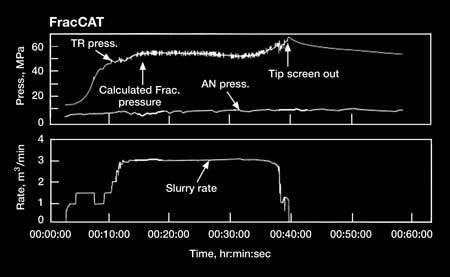
zone at frac pressure. The end result was that 30% less pumping horsepower was required during treatment; and
calculated frac gradient was 55 MPa (7,900 psi). As shown on the performance curves, Fig. 4, the pumping
operation began at 55 MPa and continued until screenout. In all, 25,000 kg (55,000 lb) of carbo-prop were
placed in the formation. In summary, Stimgun eliminated a potential stimulation problem, resulting in an
improved well completion.
|