September 1999
Supplement
99-09_ptd_waterflood-boneau_fig3.htm (Sep-1999)
A monthly magazine offering industry news, statistics and technical editorial to the oil and gas drilling, exploration and production industry.
 |
|
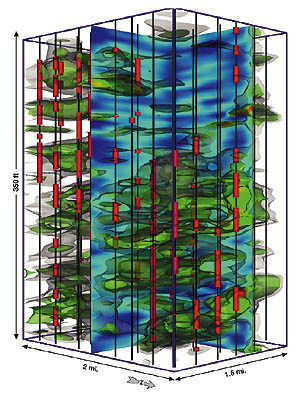
Fig. 3. This 3-D contour diagram shows porosity volume in waterflood pilot area. High flow capacity 6% porosity volumes are translucent green. Surrounding 4% porosity, which provides connectivity, is translucent gray. View is from the northeast. (3-D contouring algorithm with permission from KitWare, Inc.) |
|
|
Copyright © 1999 World Oil
Copyright © 1999 Gulf Publishing Company

