Waterflood in Kansas field should boost recovery by five million bbl
Waterflood in Kansas field should boost recovery by five million bblRodney Reynolds (reynolds@cpe.engr.ukans.edu), Tertiary Oil Recovery Project, University of Kansas Energy Research Center, Lawrence, Kansas Bottom line. Engineered waterflooding — based on integrated reservoir characterization and modeling work — has proven to be profitable in Stewart (Morrow) field in western Kansas. Oil production increased from 270 bopd before waterflooding to more than 3,100 bopd afterwards. Incremental waterflood recovery to date is over 1.5 million bbl of oil, and current estimates of incremental recovery are 5.3 million bbl, or 23% of original oil-in-place (OOIP). Field history. With cumulative oil production of more than 200 million bbl, and much of the production still in the primary stage, the Morrow reservoirs are a significant resource. While waterflooding has the potential to recover significant amounts of oil, often there are hurdles. First, waterflooding typically requires unitization, which can be a challenge in Kansas. Second, assuming unitization is resolved, recovery often is adversely affected by poor sweep efficiencies and inadequate reservoir management. Stewart field, discovered in 1967, is long and narrow (4-1/2-mi by 1/4- to 1/2-mi) and covers about 2,400 acres. Production is from a basal Pennsylvanian Morrow sand at about 4,750 ft. Oil gravity is 28°API, with low solution gas (37 scf/bbl). Initial reservoir pressure was about 1,100 psi. With an estimated bubble-point pressure of 180 psi, the oil is highly undersaturated. From discovery through 1984, only four additional wells were drilled. Active field development, which resulted in 43 producing wells and 14 dry holes at the time the project started, took place from 1985 to 1994. Wells produced with only minor stimulation until a field-wide hydraulic fracture program was started in 1991. Working with field operators, the University of Kansas in 1993 implemented a waterflood development project as part of a U.S. DOE reservoir class project. At project start, cumulative oil production was about 3.5 million bbl, and daily field production was about 270 bopd. An initial reservoir evaluation examined:
Unitization and field implementation. Differences of opinion among operators made unitization difficult. Eventually, North American Resources Co. (NARCO) of Butte, Mont., bought out the other interest owners. Prior to unitization, a small independent, Sharon Resources, along with the University of Kansas, independently modeled Stewart field, matching primary production and evaluating different waterflood options. During this time, NARCO became the unit operator, and began injection in October 1995. Resolving discrepancies. Inconsistencies in the apparent reservoir volume were identified early on. Volumetric mapping of the net sand indicated only 22 million bbl OOIP. Material balance calculations, which assumed no water influx and used initial and field-wide shut-in pressures measured in 1989 and 1991, indicated OOIP in excess of 100 million bbl. Uncertainties in fluid and rock properties could not explain the inconsistencies. Either a large volume of the reservoir was yet to be defined or pressure support from limited water influx was occurring. Detailed reservoir modeling and simulation were required to define this critical parameter. Sharon Resources provided the data used in modeling and reservoir simulation studies, including porosity / permeability correlations for the three major zones, relative permeability data and well histories. Well data included location, date of completion, perforation intervals, wellbore radius, skin factor, stimulation history, production history and pressure constraints. To identify distributions in the regions between wells, it was necessary to contour the tops, bottoms, porosity, permeability and water saturations for each zone. An external aquifer was included as the fourth layer in the model. None of the wells was perforated in this layer. The reservoir model contained 12,000 gridblocks (typically, two or three gridblocks between each well) with average dimensions of 190 by 250 ft. Final modeling studies matched actual production within a 4% range. OOIP estimates were 23 million bbl, supporting the volumetric estimate and confirming pressure support from limited water influx. Modeling and simulation studies were performed using a Silicon Graphics workstation with Western Atlas VIP Executive simulation software. Reservoir simulation studies were performed, with Sharon Resources using the Internet to connect to the University of Kansas’ workstation. Choosing waterflood pattern. Since the mobility ratio was favorable, a high volumetric sweep efficiency was anticipated in regions contacted by the injected water. In considering potential patterns, design planning focused on injecting water into wells that contacted the most productive sand. Source water availability restricted injection rates to 6,000 bwpd. Ultimately, the performance of six proposed patterns (a three-line drive, five-line drive, seven-line drive, and three modified line drive patterns) were simulated over 10 years. In each case, the water was distributed equally between each injection well within the proposed pattern. The original waterflood model showed:
NARCO implemented a modified six-line drive in October 1995, injecting water into six injection wells, Fig. 1.
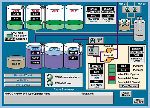
Implementing the waterflood. In developing the waterflood facilities, NARCO incorporated state-of-the art, computerized monitoring and emergency shutdown systems. Automated equipment within the system includes: tank-level sensors, flowmeters, status readings for injection pumps, a LACT unit, bypass switches and emergency shutdown valves. Although costs were about 2% higher than those of a typical Kansas waterflood facility, incremental costs were justified by:
Since reservoir modeling is an ongoing process, as additional data become available, the model has to be "tweaked" to maintain an accurate history match. The original computer model developed at the University of Kansas’s Tertiary Oil Recovery Project (TORP) was revised in early 1998 to history-match waterflood production and injection. To match waterflood performance data, some modifications of the model were required. The basic model structure was retained, but changes in petrophysical (skin, x and y permeability) properties were made to get a reasonable match in the oil and water production peaks and the arrival of the waterflood fronts. This revised model verified suspected regions of unswept oil, which resulted in additional wells being converted to injection and infill drilling. Project results. In October 1995, six producing wells were converted to injection. Full field implementation costs were about $1.8 million, of which lease automation accounted for only about $40,000. Production response occurred within six months of initial injection, increasing from under 300 bopd to 1,700 bopd by October 1997 when NARCO sold the property. Implementation costs had already been paid out. After buying the waterflood, PetroSantander, Inc., subsequently converted another six production wells to injection. Production continued to increase, reaching 3,150 bopd in early 1999. Incremental waterflood recovery to date is over 1.5 million bbl of oil, and current estimates of incremental recovery are 5.3 million bbl, or 23% of OOIP. This is higher than originally anticipated. In the revised history match for the field (Fig. 2), there are three distinct production peaks. The first is due to field-wide development, the second is due to the hydraulic fracturing program and the third is response to the waterflood. The successful implementation is especially noteworthy, considering the succession of unit operators. The continuity of the reservoir management effort, supported by the reservoir database and modeling efforts, contributed greatly to the project’s success. Lessons learned. The success of the Stewart field waterflood is, first of all, due to the commitment of the primary operators, which NARCO demonstrated by buying out other interest owners. This led to unitization and extensive reservoir modeling and simulation work. It resolved inconsistencies in reservoir volume and defined the parameters important to waterflood recovery. Using this reservoir modeling and simulation work, NARCO implemented waterflooding, converting some of the better production wells to injection wells. PetroSantander assumed ownership and continues to expand the number of injection wells. Modern automated injection facilities improve operations, allowing ready collection of production / injection well data essential for ongoing reservoir management. Simulation work, performed at periodic intervals, provides operators with an increasingly refined reservoir model, the foundation for operations and implementation decisions. Acknowledgment The author thanks the following for their contributions to the project: North American Resources Co., Sharon Resources, PetroSantander, Tertiary Oil Recovery Project, University of Kansas and the U.S. Department of Energy’s Office of Fossil Energy. The authorRodney Reynolds is a petroleum engineer with the Tertiary Oil Recovery Project (TORP) at the University of Kansas in Lawrence. He also is director of the Petroleum Technology Transfer Council’s North Midcontinent Region. Before joining TORP in 1990, he owned and managed his own petroleum engineering consulting company and was employed as a senior production engineer for Gulf Oil Corp. He holds a BS in petroleum engineering from the University of Tulsa. Copyright © 1999 World
Oil |