47th annual Reed-Hycalog rig census
DRILLING TECHNOLOGY47th annual Reed-Hycalog rig censusU.S. rig fleet contracts for the first time in two yearsMatt Overbeck, Marketing Analyst, Reed-Hycalog, Houston
Statistical Highlights Several key statistics from the census include the following:
Rigs Removed From The Fleet During the census period last year, the drilling industry began to feel the downward pressure of activity as a result of falling commodity prices. This year, the effect of low prices was seen in reduced rig availability numbers. One hundred rigs were deleted from the U.S. fleet, the largest amount since 1997. Fleet reductions are reported in five categories, Table 1:
Previously, census rules excluded rigs from the available count that required — to be put back to work — a capital expenditure of over $100,000 for land rigs and $1,000,000 for offshore rigs. In 1999, census rules were clarified to exclude drill pipe from the monetary limits placed on rigs requiring a capital expenditure. With this clarification, rigs deleted for this reason increased to 46 from only 29 last year. In addition, rig owners were asked if they had capital improvements planned for the next 12 months for each rig they owned. Contractors responded that, during the next year, 5% of available units are scheduled for capital improvements, vs. 6% last census. Rigs auctioned for parts or cannibalized to support other units increased after two years of decline. Forty-one rigs were scrapped during the past year, vs. 22 in 1998. This increase illustrates how contractors maintain a workable fleet in an industry environment where rig rates do not support new builds. The number of rigs deleted from the census because they were stacked for more than three years diminished for a fourth straight year. Two rigs were dropped from the available count this year, vs. eight in 1998. Rigs that were destroyed during the past year comprise another category for deletions. Owners reported four previously available units as damaged beyond repair. Rigs typically move into and out of the U.S., and are tracked in the census each year. Seven rigs moved out of the U.S. this year, vs. 10 last year. Two units moved to Argentina, plus one each to Brazil, Japan, the United Kingdom, and Venezuela. One rig moved to an undisclosed location. Considering that seven rigs moved out of the U.S. this year, while six moved in, there is a net decline of one unit resulting from rig moves. Movement into the U.S. is covered below. Rig Additions – Mostly Back Into Service In 1997 and early 1998, the drilling industry mobilized additional rigs to meet growing demand for units. However, that momentum slowed through the last half of 1998 and the beginning of 1999. This year, 39 units were added to the U.S. fleet, not enough to offset reductions. Fleet additions fall into one of four categories, Table 1:
Nine units were assembled from components this year, down from 62 last year. This indicates that the supply of rigs previously deleted from the census has been virtually exhausted by cannibalization. The number of rigs brought back into service also dropped in this year’s census. Eighteen rigs were reactivated this year, vs. 37 in 1998. Each of these rigs had been counted in previous census tabulations, but was subsequently removed due to becoming inactive or inoperable. Six newly manufactured rigs were added to the fleet this year, the majority as a result of plans made before commodity prices bottomed. Owners reported building five new land rigs and one offshore unit. Three land rigs were built in California and two in Alaska, while the offshore rig is presently working off the Louisiana coast. This year’s number is significant, given that the average number of new rigs has been 1.9 units for the U.S. since 1989, signaling a tempered optimism for the long-term health of the U.S. drilling industry. Six rigs were brought back into the U.S. during the 1999 census. Two land units were brought in from Mexico, while two offshore units were added from Venezuela. Two more marine units were added also, one from South Africa and one from an unknown origin. Total rig additions numbered 39, while deletions totaled 100. Therefore, the net change in the rig fleet this year was a 61 unit decrease, the largest decrease since 1996, Fig. 3. Drilling Activity Falls As expected, census statistics reveal a sizable decrease in drilling activity over the past 12 months. The 1999 active count was 860, down from 1,305 in 1998, the lowest number of active rigs in census history. The methodology used to count active rigs for the Reed-Hycalog census is different from other active weekly rig counts that record units drilling during a single day. The census counts a rig as active, if it has "turned to the right" any time during a defined 45-day period (this year’s period was between May 8 and June 21). Therefore, the Reed-Hycalog statistic always will be higher than other reported counts, because a longer time period is used to monitor rig activity.
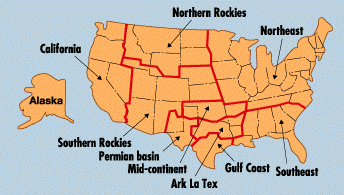
There was great variance in U.S. regional activity levels, with all regions showing declines in the number of working rigs from one year ago, Table 2. Regional unit declines were as follows: Gulf Coast (–97), Southeast states (–74), Mid-Continent (–64), ArkLaTex (–54), Permian basin (–54), California (–36), Southern Rockies (–33), Northern Rockies (–18), Alaska (–10), and the Northeast states (–5). The 784 available rigs that were not drilling during the census period were classified according to the length of time they have been idle. Rigs stacked less than one year numbered 619; one to two years, 148; and two to three years, 17. Aging rules of the census state that any rig stacked for longer than three years will be removed from the available fleet. Adding the 619 rigs stacked less than one year to the 860 active units in the census provides the total number of rigs that drilled sometime during the past year. The full-year utilization figure indicates that 1,479 out of 1,644, or more than 89% of the available rigs, were put to work by rig owners, as compared to 97% in 1998. Types of contracts covering the active rig fleet illustrate the changing economic environment contractors have faced in the past year. Last year, with better economic conditions, contractors saw the percentage of day work contracts rise to 65%, a trend that has steadily increased since 1992. This year, day work contracts fell to 63% of all contracts, as commodity prices tightened drilling budgets. Footage contracts fell to a 25% share, down from 27% last year. Turnkey contracts were up four percentage points, to 12%, further illustrating the market conditions of the previous year, Fig. 4. Other information that was gathered on the last well drilled by each active rig includes the following:
Rig Supply / Demand Curve Diverge As one indicator of industry health, rig utilization measures the supply and demand balance. This year’s utilization, the ratio of active to available rigs, showed a sizable decline of 24 percentage points. For 1999, utilization was down to 52.3%, the lowest level since 1987. Utilization has averaged 73.0% over the history of the census. Nine out of 10 U.S. regions cited declines in gross utilization for 1999, Table 3. The one region showing improvement was the Northeast states, up to 66% from 62% last year. Alaska led all other regions with the greatest drop, down 45%, for a gross utilization rate of 30%. Utilization figures for other regions were as follows: Southeast states, 58%, down 27%; ArkLaTex, 56%, down 26%; Gulf Coast, 54%, down 28%; Mid-Continent, 54%, down 25%; Southern Rockies, 51%, down 21%; Northern Rockies, 44%, down 22%; Permian basin, 48%, down 21%; and California, 29%, down 43%. Looking at land rigs and offshore rigs separately, gross utilization declined to 51% for land rigs, down from 75% in 1998, Fig. 6. The offshore utilization ratio has been stronger than the land ratio for the past several years and continues to be in 1999. Although dropping 21 percentage points, offshore utilization, at 62%, was still significantly higher than the land ratio. According to the census, bottom-supported and floating rigs were in greatest demand. Utilization for these two types of rigs was 73%, Fig. 7. Inland barge utilization fell 35 percentage points to 46%, while platform rig utilization fell 18 percentage points to 38%. As previously stated, overall gross utilization was 52.3% during the 1999 census period. A 52.3% utilization rate does not necessarily mean that rigs were working 52.3% of the time, because a rig drilling just one day during the 45-day census period would be counted as 100% utilized. However, rig owners were asked to estimate the number of days during the 45-day period their rigs were actually on jobs (moving days not counted). The average number of days each unit was utilized was 33 this year, down from 36 in 1998. Applying this factor to the 52.3% gross utilization rate gives an "on-the-job" utilization of 38%, significantly less than 61% reported last year. Large Contractors Continue To Grow "Consolidation" continues to best describe the industry’s dynamics in 1999. The total number of rig owners dropped by 21 this year, to 219, Fig. 8. Less than one-third of all rig owners who were in business in 1987 still remain today. The number of rig owners has been declining since the census first began counting them in 1987. Drilling contractors own 97% of all drilling rigs, an increase of one percentage point since last year. Over the past year, 137 rigs, or about 8% of the fleet, changed ownership through mergers or acquisitions. The 137 units do not include rigs that were sold and subsequently scrapped for parts. Contraction in the industry put even more units in the hands of larger rig owners. Fifty-four percent of the available U.S. fleet is now controlled by companies that hold 20 or more rigs, Fig. 9; up four percentage points from last year. This is a sharp increase, considering that just three years ago these companies owned less than 30% of all units. The average rig owner now holds 7.5 rig in his fleet, up from 7.1 last year. Contractors Optimistic For Long-Term A survey of contractors taken in conjunction with the rig census uncovers interesting perceptions of the industry. Forty-seven contractors from across the U.S. chose to participate in this year’s survey, representing about 21% of the industry. The number of responses from each region is listed below:
Important issues. For the tenth year, contractors were asked to rank a set of issues by importance to their business. As might be expected, "rig rates" are of the highest concern to contractors, as was the case last year, Table 4. The lowest activity levels in history have obviously caused contractors to feel the pinch once again.
In 1996 and 1997, with the industry in a growth period, rig owners reported "crew availability" as their primary concern. With the slowdown in 1998, crew availability slipped to a distant second, however, this year it was ranked a close second to rig rates. This illustrates contractors optimistic outlook for the future as they begin to look for trained crews to help put their rigs back to work. "Aging of rig equipment" ranks third on the list of issues affecting contractors, up from number five in 1998. "Drill pipe replacement" has slipped to fourth on the list, with "availability of rig parts" at fifth.
Rig rate declines. The previously stated issues are consistently the top five concerns each year of the survey; switching positions as industry conditions fluctuate from year-to-year. Rig rates, however, are the economic key that allows all other concerns to be addressed. According to survey data, land rig rates in actual dollars have averaged $5,482/day (excluding Alaska) during the past month, representing a 15% decrease from day rates cited one year ago. In addition, land contractors were asked to estimate the change in land rig day rates, Table 5. Estimates revealed a decline of 12%, in line with the "actual dollars" calculations. Offshore rates averaged $19,560/day, and contractors tell us that this is almost a 100% decrease over last year, although offshore data is not statistically significant, due to sample size. Crews / capital constraints. In 1998, contractors were asked to estimate the percentage they could increase drilling days if crews or capital, individually, were not a constraint. That year, the respondents estimated they could increase drilling 25% and 27%, respectively, if crews and capital were not a restriction. This year, as expected, contractors reported more slack in the market, estimating a possible 50% and 61% increase, respectively. Contractors estimate that rig activity is off over 30% this year, consistent with the census’ active rig count. However, contractors believe the market will begin to rebound in late 1999, and increase 20% in 2000. Oil / gas prices, competition, outlook / plans. Last year, as commodity prices were beginning to suffer, we asked respondents to estimate the price level that would begin to cause an adverse effect on their business. Contractors cited, on average, a floor of $14.32/bbl for oil and $1.78/Mcf for natural gas. This year, with prices low, we asked contractors to estimate at what level commodity price would begin to have a positive effect on their business. On average, respondents stated prices of $19.30/bbl and $2.58/Mcf. At the time this article was written, both oil and gas prices were above this mark, hopefully signaling a rebound in the U.S. drilling industry. Despite continued consolidation, competition remains strong. When contractors were questioned about the percentage of wells they drill under alliance contracts with other service companies, 21% reported participating in such contracts on 5% of wells, down from a 7% share in 1998. Also, for the fourth consecutive year, the number of contractors typically bidding on a well averaged close to five.
Last year, respondents predicted a couple of tight years followed by relatively strong growth in the future. Most contractors now feel that the hardest times are behind the industry and activity should increase in the latter half of 1999 with significant activity in 2000–2001. When questioned about their plans for the next five years, contractors reflected their cautiously optimistic attitude, Table 6. Forty-seven percent do not have any plans for change in the coming years, signaling a desire to wait for the upturn and again realize profit. Twenty percent are looking to expand and 16% are looking for merger opportunities, forecasting a continuation of the consolidation trend. Thirteen percent of contractors will explore international opportunities, while 9% are looking to diversify their operations. Only 2% of contractors are looking to downsize their fleets.
Increase In Utilization Predicted Low commodity prices caused the U.S. industry to adjust to lower spending and activity levels. This adjustment caused a net decline in the number of available rigs in the U.S. for the first time since 1996. As oil and gas prices improve with worldwide production cuts and increasing demand, drilling activity should begin to increase in the U.S. during the latter part of 1999. Contractors tell us that 70% of their stacked rigs have a greater than 50% chance of going back to work in the next twelve months. Reed-Hycalog predicts that available rigs will stay at 1999 levels as demand will be satisfied by rigs currently stacked. In light of this knowledge, you can expect utilization percentage to increase significantly over this year’s low level. As activity increases, Reed-Hycalog predicts that utilization will increase to historical census levels or 73%. This will result in a Reed-Hycalog active rig count of 1,200 units. Acknowledgment The following Reed-Hycalog personnel and representatives are recognized for their contributions as regional coordinators in this year’s census: Mark Davis and Terry Harper, Houston and Texas’ Gulf Coast; James Defenbaugh, ArkLaTex; Dave DeMaio, Northeast States; Greg Fisher, Northern and Southern Rockies; David Avery, Southeast States; Jon McClendon, California; Dean Setzler, Permian basin; Pat Sauvageau, Alaska; and Jeff Walker, Mid-Continent. The following personnel also assisted in counting rigs for the 1999 census: Dickie Bailey, Peter Batton, Butch Bawcom, Stan Davis, Gary Einer, Steve Gibson, Curtis Herndon, Sid Hingle, Duane Kippes, Charles Koenig, Lynne Leago, Roy Lyles, Steve Mayo, Larry McCarty, Ronnie Price, Russell Robinson, Steve Shafer, Al Simon, Jim Smith, Jim VanWagoner, Charles Verret and Mark Windham.
The author
Copyright © 1999 World
Oil |
|||||||||||||||||||||||||||||||||||||||||||||||||||||||||||||||||||||||||||||||||||||||||||||||||||||||||||||||||||||||||||||||||||||||||||||||||||||||||||||||||||||||||||||||||||||||||||||||||||||||||||||||||||||||||||||||||||||||||||||
 Matthew
T. Overbeck is a marketing analyst at Reed-Hycalog.
He graduated with a BA degree in economics from The University of Texas at Austin in 1997.
He co-authored the 1998 census.
Matthew
T. Overbeck is a marketing analyst at Reed-Hycalog.
He graduated with a BA degree in economics from The University of Texas at Austin in 1997.
He co-authored the 1998 census.- Applying ultra-deep LWD resistivity technology successfully in a SAGD operation (May 2019)
- Adoption of wireless intelligent completions advances (May 2019)
- Majors double down as takeaway crunch eases (April 2019)
- What’s new in well logging and formation evaluation (April 2019)
- Qualification of a 20,000-psi subsea BOP: A collaborative approach (February 2019)
- ConocoPhillips’ Greg Leveille sees rapid trajectory of technical advancement continuing (February 2019)

