Ultrasonic measurements monitor casing offset damage
SPECIAL REPORT: OCTGUltrasonic measurements monitor casing offset damageMonitoring of casing damage caused by relative movement of a field’s formation layers can be done by using an ultrasonic casing inspection tool that does not need any special modificationsC. W. Morris, Schlumberger Wireline & Testing, Houston; R. L. Gwinn, Aera Energy; F. H. K. Rambow, Shell E&P Technology; and D. P. Mitzel, Schlumberger Wireline & Testing, Vernal, Utah
Evaluation of wellbore casing mechanical damage, corrosion and cement bond has been performed for many years. Wireline tools available for these services range from simple mechanical devices to ultrasonic measurement techniques designed specifically for steel casing and the cement environment. However, these devices normally measure casing parameters, such as internal radius, in only a 2-D horizontal plane from within the wellbore.
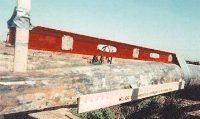
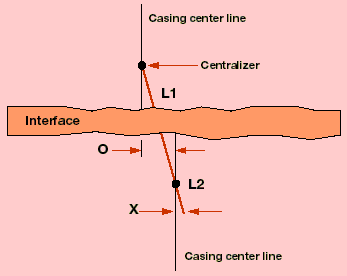
Casing offset monitoring requires knowledge of the tool’s horizontal displacement vs. depth, as it traverses the damaged interval. The casing radius may not actually be affected by limited offset conditions. Observation of damaged casing removed from several wells generally has shown this interval to be less than 10 ft in length, Fig. 1. Because of the unique measurement capabilities of the UltraSonic Imager (USI) cement evaluation tool, it is now possible to measure casing offset accurately and use this outcome to predict casing failure. Because casing damage generally occurs across a short depth interval, the tool does not need any special modification to determine casing offset dimensions. In addition, the casing’s inside radius, thickness and cement conditions can be monitored to evaluate potential failure mode. The information then can be used to better manage well and field production. Measurement & Methods The USI uses a single ultrasonic rotating transducer, immersed in the wellbore fluids, to generate a pulse that strikes the casing at normal incidence and causes it to resonate in thickness mode.1 The echoed response from the signal pulse is measured by the same transducer functioning as a receiver. The received signal is processed and the measurement repeated numerous times during each rotation. From these repeated measurements vs. depth, the casing’s mechanical integrity can be determined with full azimuthal coverage. Cement conditions can be determined from the resulting casing resonance and echo strength. Casing radius is determined from the measured transit time for the first echo to return. The initial acoustic response consists of a large reflection from the casing’s internal surface. Time of arrival and amplitude of the initial echo depend on the standoff distance from the transducer to the casing, and the borehole fluid acoustic velocity. Transit times are estimated by fitting a quadratic polynomial through the three adjacent, maximum absolute-magnitude peaks of the waveform. A very short normalization window is used to select the initial reflection that is substantially unaffected by casing resonance, signal frequency spectral variations caused by fluid attenuation, or transducer variations with temperature and pressure. The actual acoustic properties (velocity of sound and acoustic impedance) of the borehole fluids are measured vs. depth so that an accurate model can be developed. Accordingly, the resolution and relative accuracy of the casing inspection tool’s radius measurements are 0.002 in. and ±0.008 in., respectively. Calculation of the casing offset is performed using similar triangles from this simple relationship:
Where: O = casing offset; X = transducer sub-offset; and L1 and L2 = tool dimensions. The basic geometric relationship for the tool and radius measurements is shown in Fig. 2. It is assumed that:
If these assumptions hold, then actual calculation of the offset becomes trivial, once the tool transducer’s maximum deflection is determined from radius measurements. The travel time plot across the region of maximum eccentering, just before the transducer passes across the bend, is shown in Fig. 3. Clipping of the travel time is evident, because the transducer is too close to the casing. Ideally, both the minimum and maximum travel times could be used to perform a consistency check of the data. When this is not possible, one must rely on the maximum value. The raw travel time value read from the plot is 1,213 microsec. multiplied by 10. At least one other bit of data, average travel time (casing diameter), must be known to calculate the offset. This information should be obtained at or near the same depth as the maximum travel time value. Because of data clipping and other distortions, one should measure the average time from a nearby depth, where the tool is essentially centered. The figure shows an interval about 3 ft from the maximum travel time signal depth, where tool centering is good. Therefore, the travel time eccentering in this example is 1,213 to 1,023, or 19.0 microsec. Using a two-way travel time of 32.5 microsec./in., this translates into a transducer sub offset (X) of about 0.585 in. To approximate the casing offset (O) from the centerline, one must use the equation given above and the appropriate tool dimensions for L1 and L2. When the offset is not too great, the calculation can be done using eccentering values on the field log. For a larger offset, use the maximum radius, up to the limits of the tool transducer sub displacement. Maximum transducer sub displacement can be determined for specific casing and sub sizes. Decentralization of the transducer sub greater than about 1.4 in. causes acoustic data loss, because the transducer is too near the casing wall. However, the corresponding casing offset is over 4 in., in 7-in. diameter casing. In some cases, severity of the casing offset ultimately may prevent the wireline tool from passing through the damaged interval. Once the casing offset is known, additional information with regard to forces acting on the casing may be deduced using specific casing radius changes and cement condition information. The casing joint may fail in:
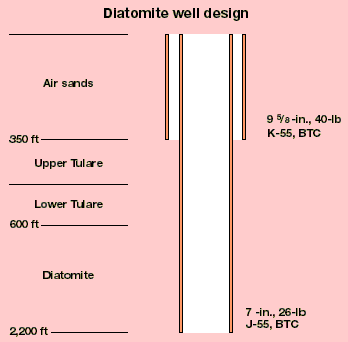
The mode of failure may be used to estimate casing life. Field Results (California) Well casing damage caused by formation compaction has occurred in many California reservoirs. One area particularly susceptible to this problem is Kern County’s diatomite reservoirs.2 These have a high-porosity, high-compressibility rock matrix that compacts as field production depletes reservoir pressure. Belridge field has produced since the 1970s, and has seen surface subsidence and wellbore failures throughout this period. Waterflood operations have reduced the surface subsidence rate, but well casing failures occur throughout the produced area and continue to significantly influence field operations. Simulations have shown that although the waterflood has successfully mitigated surface subsidence, it also has increased lateral gradients in effective stress that, in turn, have accelerated subsurface, horizontal layer interface motions.3 The field consists of two independent production zones—the overlaying Tulare formation and the diatomite reservoirs. These wells utilize 7-in. and 51D2-in. casing. A typical Belridge wellbore design is shown in Fig. 4. The Tulare formation produces 11°-to-14° API oil from layered, discontinuous reservoir sands. The diatomite reservoir generally produces low-gravity oil (10°-to-34°API) from about 800 to 3,000 ft. Average rock porosity is 40% to 70%.
More than 90% of all well casing damage to date has been above the diatomite reservoir. Damage has been focused at two particular intervals: 1) the interface between the Tulare formation and diatomite reservoir, and 2) a second horizon, 300 to 400 ft above the diatomite reservoir. Field observations of pulled casing from damaged wells show that the sheared casing joints can have lateral offsets of up to 12 in.3 Damage can occur over a range extending from very short vertical distances of less than 4 ft, on up to tens of feet. Various mechanisms for casing damage have been identified. Compression failure can be induced within the producing interval because of large vertical strains associated with formation compaction. Tensional failure can result from elastic mismatch between the compacting reservoir and the stiffer overburden that resists subsidence as the reservoir compacts. Shear failure can be induced, either by large horizontal displacement along the flanks of a subsidence bowl or possibly by local slip along weak bedding plans, or by reactivated faults in the overburden above the reservoir.3
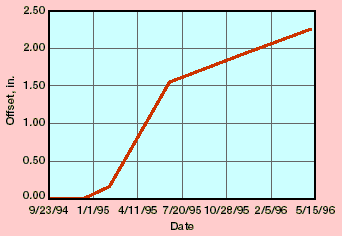
As part of the field’s continuing well monitoring program, ultrasonic casing inspection logs were run periodically in specific wellbores to measure casing conditions. It was observed that the evaluation tool, while accurately measuring the casing’s inner radius, also could be used to measure casing joint offset, when displacement occurred over a short vertical length. As shown in a standardized, ultrasonic evaluation format, the zone in Well 2 at about 750 ft clearly reflects typical casing joint damage, Fig. 5. Log tracks 3 and 4 illustrate the transducer motion in terms of signal amplitude and radius, as it traverses the casing displacement interval while logging up. Actual offset in the casing across the diatomite / Tulare interface is normally a region of data loss as the transducer swings close to the casing wall. This occurs when the upper centralizer is in the wellbore’s vertical section above the offset, and when the lower centralizer traverses the damaged interval and moves into the undamaged, vertical portion of the casing. The radius (and image) data generally are missing around the entire casing circumference. The disturbed image region just below this zone is where the transducer shows maximum eccentering from the casing centerline (as in Fig. 2) when the upper centralizer pulls out of the top of the offset interval. The two centralizers are now across the damaged interval. The curve in Track 1 shows that maximum eccentering is observed at 753.5 ft. At this interval, the casing offset was calculated to be about 1.56 in. Using this technique, the offset at particular depth intervals for nine wells monitored since 1995 has been calculated, Table 1. It is apparent that a well’s location and the specific formation interval play a role in determining the degree of casing offset as a function of time. Some field sections will experience more casing failures than others, which is partially a direct function of local fluid production and injection history.
To validate the technique described above, casing from one of these wells was pulled, and the actual casing offset was measured at the surface, Fig. 1. The damaged casing joint had an offset of about 2.25 in. over a vertical length of 44 in. This well had a maximum measured offset of 1.56 in. recorded 10 months before the casing was pulled. Offset data from Well 2 are shown in Fig. 6. A projection of well offset data to the time period at which the casing was pulled from the well shows that the maximum offset might be as large as 2.75 in. However, as discussed above, the offset rate will probably not be linear with time because of local reservoir factors, such as production / injection and depth and field location, affecting the subsidence rate.
Multiple data points from the other wells described above can be used to estimate the probable time to casing failure in other field areas in a similar manner. With appropriate consideration of reservoir dynamics that can influence local subsidence, overall field operating conditions will be reflected in the measurements. Gulf Of Mexico Example In many areas of the Gulf of Mexico, salt formations are encountered during drilling. As drilling progresses through a salt layer, irregular wellbores can be created. Washouts, restrictions, ledges and moving salt exert non-uniform loads on casing. Casing across salt zones is subject to tension, compression, burst and hydrostatic loads combined with non-uniform forces. These must be included in casing design calculations. Increasing the casing’s wall thickness offers better resistance to these loads than higher-yield-strength steels, so heavy-wall casing can be used, if salt creep rates are low and good cement jobs can be obtained. In more extreme cases of rapidly moving salt, liners cemented inside casing will increase non-uniform load capacity by reducing casing deformation. Collapse resistance of properly cemented concentric strings can equal or exceed the combined strengths of individual liners and casings.4 After casing is set, salt begins to flow around it to fill the void left by drilling. The non-uniform directional flow around the casing produces a directional stress, deforming the casing over relatively short depth intervals. In most cases, deformation will result in decreased inner casing radius and a bend in the pipe. When sufficient horizontal stress is applied to casing, failure can occur as shear or collapsed casing. Again, if the casing bend or offset can be measured as a function of time, failure can be predicted. For this well, the ultrasonic evaluation tool was run using a 5-in. transducer sub to record the eccentering data through the casing bend in a 7-in., 20 lb/ft casing wellbore. Results from these jobs showed that, when the tool was centralized and its ends did not touch the inner casing wall, the inner diameter measurement was very accurate, and the casing offset could be determined as discussed above.
However, in this example, casing distortion was not a simple offset, but a short bend of about 20 ft in total length. Furthermore, this tool was not equipped with a knuckle joint between the sonde and telemetry cartridge. The knuckle joint prevents the tool’s top end from hitting the casing’s inner wall and limiting the transducer sub’s eccentering motion. Therefore, the measured offset values are minimum measurable displacements and not the true offset values. As regards a short casing bend, only horizontal displacement in the lower part of the bend could be determined. The casing was pulled from the well, and a comparison of the actual offset to the measured value is listed in Table 2. The ultrasonic evaluation tool’s presentation of casing measurements across the lower part of the casing bend is in Fig. 7. Acknowledgment The authors appreciate the cooperation and assistance of Aera Energy LLC, Shell E&P Technology Center and Schlumberger Wireline & Testing in the development of this technique, support for the interpretation work and permission to publish this article. This article was adapted from SPE Paper 49254, "Monitoring casing offset damage using ultrasonic measurements," prepared by the authors for presentation at the 1998 SPE Annual Technical Conference and Exhibition, New Orleans, Louisiana, Oct. 27–30, 1998. Literature Cited
The authors
Copyright © 1999 World
Oil |
||||||||||||||||||||||||||||||||||||||||||||||||||||||||||||||||||||||||||||||||||||||||||||||||||||||||||||||||||||||||||||||||||||||||||||||||||||||||||||||||||||||||||||||||||||||||||||||||||||||||||||||||||||||||||||||||||||||||||||||||||||||||||||||||||||||||||||||||||||||||||||||||||||||||||||||||||||||||


 Dr.
Charles Morris is a reservoir engineer at
Schlumberger with over 25 years of industry experience. He works in the Houston Technical
Applications Group, which provides technical support for new cased-hole and testing
measurements. Before assuming his present position, Dr. Morris was the reservoir engineering
manager for the Schlumberger Gulf Coast Unit from 1984 to 1991. He began his career as a
research engineer for Phillips Petroleum Co. and has worked as manager of reservoir
engineering for an independent drilling and operating company in California. Dr. Morris
earned MS and PhD degrees from Texas Tech University.
 Bob
Gwinn is a reservoir surveillance engineer for Aera
Energy LLC. He works on compaction, subsidence and well damage issues associated with Aera’s
Diatomite Asset. Mr. Gwinn holds a BS degree in petroleum engineering from West Virginia
University.
  Dr.
Fritz Rambow joined Shell in 1978 after doing
postdoctoral work at Rice University. Working initially on seismic absorption and
attenuation problems, he joined the Petrophysics Group at the Bellaire Research Center in
1980, where he built and ran Shell’s borehole televiewer. Dr. Rambow holds numerous
patents related to the televiewer, borehole imaging and acoustics. After helping to build a
petrographic image analysis lab in Rijswijk, The Netherlands, he returned to Houston in
1987. As a result of his interest in compaction he extended the petrographic workstation
capabilities to include compressibility estimates from thin sections. Dr. Rambow is now
active in downhole measurement technology for "smart wells."
  Dean
Mitzel is Schlumberger Wireline & Testing’s
district manager in Vernal, Utah. He joined Schlumberger in 1981 as a field engineer and has
worked in various Texas and California locations. Mr. Mitzel was a Sales Engineer in
Bakersfield, California, from 1988 to 1996. He earned his BS degree from Old Dominion
University and an MS degree from the University of Southern California.
