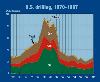
United States: U.S. drilling
U.S. DRILLINGA year of wait-and-see
And while oil prices have improved slightly from the record lows (when adjusted for inflation) reached last December, most industry watchers report few (if any) leading indicators that would suggest a turnaround. As a result, most are extrapolating this depression well past 1999. However, there is reason (as explained below) to hope that the bottom could be reached this year, with a strengthening in activity toward year-end. The problem is that the potential reversal cannot come soon enough to prevent the worst drilling year in recent history. The following discussion and accompanying tables and curves enumerate these basic concepts and other key factors. Details include:
Oil and gas prices. The devastating decline in worldwide E&P activity last year was brought on by the worst annual collapse in oil prices since 1900. Even before inflation adjustment, the average oil price last year was $0.60 per bbl below 1986 levels, which heretofore had held the title for "worst decline." Gas prices performed a little better, averaging $2.00 per Mcf, or about 17% below 1997. The oil price collapse was brought on by worldwide petroleum supply that apparently exceeded demand by around 2.4 million bpd during the first half of 1998. Although the imbalance eased significantly during the second half, it was too late to offset the damage. The U.S. Energy Information Administration (EIA) says world oil price (as indicated by the average cost of imported oil to U.S. refiners) should rise to about $13 per bbl by the end of 1999, then move above $14 by the end of 2000. Gas prices, according to the EIA, are projected to remain below $2 per Mcf through this summer, unless weather in the gas-consuming regions of the U.S. turns unusually cold for an extended period during the next few months. With these oil and gas price projections, there will be little chance of exceeding the activity forecast discussed below. However, a few individuals (Matthew Simmons is one) are suggesting that there may be evidence that the apparent supply surplus was more a statistical reporting error than an actuality (see page 29 of this issue), and that the oil price collapse was really brought about by the emotional trading of paper barrels on the world’s spot markets. If the above hypothesis is correct, then oil prices could begin to strengthen, possibly by mid-year. Operators would then have the incentive and increased cash flow needed to raise drilling budgets the second half. However, given the fresh memories of oil price volatility, many would likely maintain a wait-and-see attitude throughout the year. In other words, while there is a chance for improvement later this year, it would be hazardous to predict a turnaround in activity just yet.
Operator surveys. World Oil’s year-end survey of 20 U.S. major drillers (integrated companies and independents with large drilling programs) and 235 independents indicates mixed expectations for 1999. Majors plan 2,746 wells, down 21% from last year. Independents responding will drill 2,312 wells, up 8.4% from 1998. Both groups will concentrate on gas; 57.4% of majors’ drilling will be for gas, compared to 47% at this time last year. Gas wells will account for 75.8% of the independents’ activity, compared to 59% last year. Spending plans. Salomon Smith Barney’s annual year-end survey of 175 U.S. and international operators indicates across-the-board E&P budget cuts of 11% for this year, the most severe contraction since 1986. The reduction also is only the second in 38 years to exceed a 10% drop, and it reverses a six-year growth period. Spending plans are based on an average oil price assumption of $14.67 per bbl, which is about 24% below the price assumed at this time last year. For the U.S., the Salomon survey indicates total E&P spending of $22.06 billion this year, a drop of 20.9%. Expenditures by independents will fall by 22.8% and majors will be down 19.1%. Outside of North America, expenditures are projected at $49.8 billion, down 6.9%. Despite the large reduction expected for the U.S., the Gulf of Mexico still is considered to have the greatest exploration potential. Area forecasts. These summaries represent several important states or regions that greatly influenced the 1999 forecast. Texas is far and away the most active drilling state and, in fact, is surpassed by only two entire countries, which makes the current depression even more telling. The state’s mature producing regions are heavily dependent on oil production and thus, have been hammered by low oil prices. Overall, Texas drilling will total 6,797 wells, or 23% below 1998 figures. The high-cost waterfloods and CO2 enhanced oil recovery projects in the Permian basin of West Texas (Railroad Commission Districts 7C, 8 and 8A) will be hit the hardest, as combined drilling is predicted to drop by nearly 36% this year. Districts 3 and 4, located along the Gulf Coast and in far South Texas, respectively, will fare the best, with drilling declines of "only" 5.4% and 10.9%. More emphasis on gas development is credited with this relative strength. Extremely low prices for its heavy oil ($4 to $5 at last year’s nadir) will grant California the dubious distinction of leading all states in a year-to-year drilling decline. Onshore work is forecast to plummet from 2,400 wells in 1998 to 1,350 this year. Offshore drilling will total 32 wells, just enough to satisfy production maintenance needs. A continuation of gas development in the southern half of Louisiana will keep the rate of decline there below 5%, and increased gas activity in the oil-prone northern half will help as well. Total drilling this year should represent 1,020 wells, down 10%. Although Alaska’s most active operators, BP and ARCO, have announced substantial budget reductions, overall activity this year will be only 2% below 1998, according to the Alaska Oil and Gas Conservation Commission. Some 179 wells, which include re-entry sidetracks, are expected to be drilled on land and offshore, compared to 183 in 1998. The five states in and around the Rocky Mountains region will maintain drilling levels this year, thanks primarily to increased coal-bed methane work in Wyoming where 1,332 wells are expected, up from 1,132 completions last year. Colorado drilling will fall 14% to 484 wells. In the Mid-Continent area, Oklahoma will experience a 14.6% reduction in activity to 1,462 wells. However, considering the state’s preponderance of oil targets, expectations could have been worse. Conversely, Kansas, which is heavily gas-oriented with its giant Hugoton field, will see a 23.4% decrease in drilling to 865 wells this year. Marginal oil fields in the Appalachian and Mid-West regions obviously will suffer from current oil prices, however, lower drilling and completion costs, plus stable gas development, should keep activity reductions below the U.S. norm. Appalachia should see 3,051 wells in 1999, down 4.5%, and the Mid-West is expected to have 1,475 wells for an 8.2% decline ABOUT THESE STATISTICS World Oil’s tables are produced using the aid of data from a variety of sources, including the American Petroleum Institute, Offshore Data Services, the Texas Railroad Commission and other state agencies. In addition, 255 operating companies with drilling programs responded to this year’s survey. Please note credits and explanations in table footnotes. World Oil editors try to be as objective as possible in this estimating process to
present what they believe is the most current data available. It is realized that sound
forecasting can only be as reliable as the base data. In this respect, note that well
counting is a dynamic process and most historical data will be continually updated over a
period of several years before the "books are closed" on any given year.
Copyright © 1999 World
Oil |