September 1998
Industry At A Glance
98-09_interpretation-hardage-fig3.html (Sep-1998)
A monthly magazine offering industry news, statistics and technical editorial to the oil and gas drilling, exploration and production industry.
 |
|
|
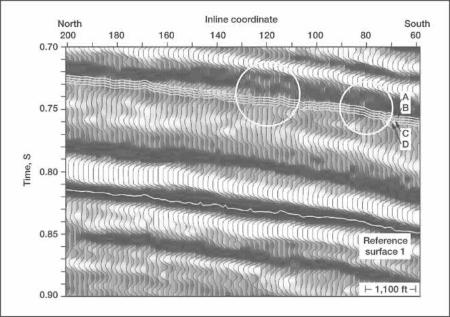
Fig. 3. Data window from crossline 200 showing stratal surfaces that traverse the southern channel facies. Surfaces A, B, C and D are approximations of surfaces of constant depositional time. The highlighted data windows encircle subtle changes in reflection waveform that identify the seismic channel facies. Inline coordinates inside these circular data windows correspond to positions of meander loops on crossline 200 in Fig. 2. |
|
|
|
Copyright © 1999 World Oil
Copyright © 1999 Gulf Publishing Company

