Real time automation optimizes production economics in Oman
Real time automation optimizes production economics in OmanPetroleum Development Oman’s on-line, real-time production automation / optimization system has increased oil production by more than 5% and is saving PDO an estimated $7 million/year in capital and operating expensesRon Cramer, Shell Services International, Houston; Cleon Dunham, Shell International Exploration and Production B.V. the Netherlands; and Alley Al Hinai, Petroleum Development Oman, Muscat, Oman
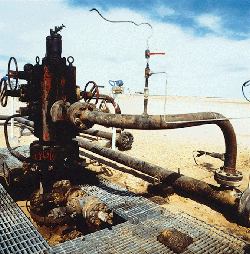
So far, PDO has installed electronic instrumentation and software on more than 1,200 individual wells and associated production facilities. Gas-lift operations are expected to yield up to 5% more oil production, with 10% less lift gas. Beam-pumped production has improved 5% because of faster response time, with a 35% increase in mean time between pump failures. ESP production is expected to increase 3%, with pump life improved. Equally important has been the accompanying reduction in manpower needed for visiting remote desert wellhead sites and, with that, much less driving and exposure to hazards. Based on this success, PDO is applying this technology throughout its Omani operations, Fig. 1. PDO’s system is part of a program in which Shell E&P operating units are aggressively installing on-line, real-time production automation and optimization systems in key oil and gas-producing areas around the world. Optimization products and expertise are also being offered to non-Shell operators. Software Suite The Shell Oil Foundation Software (SOFS) applications were designed originally to run on top of a UNIX operating system, using Hewlett- Packard’s RTAP database software. This is for basic SCADA functions, such as real-time data acquisition, alarms, trends, displays and histories. The applications are being redeveloped to run in an "open" Windows NT environment. This new software will "plug and play" with commodity SCADA or distributed control systems (DCSs) for cost-effective implementation of this software. The openness of the software platform will allow easy data exchange between real-time and corporate databases. It also will let users conveniently access real-time data from desktop packages such as the World Wide Web, spreadsheets and word processing packages. The intent is to provide and support SOFS applications in UNIX and NT environments, Fig. 2 and Fig. 3. The software used in the Oman production optimization program, SOFS, is an integrated suite of well testing and artificial lift applications developed by Shell Services International, for use by Shell E&P operations worldwide. Lift methods covered include gas lift, ESP and beam pumps. These applications are integrated in four primary ways.
The applications can be integrated or configured to plug and play, either alone or in any required combination. The package is easy to build, change and amend. Once built, the system is flexible, allowing applications to be extended simply, quickly and interactively to reflect process changes, such as new wells and test separators. Extraction of real-time data and interfacing to other systems is easy, because the suite is based on open standards. At Shell in the U.S., for example, the suite of real-time software is being linked electronically to other systems, such as product accounting. Beam Pumps During the late 1980s, PDO installed rod pump controllers (RPCs) on some beam-pumped wells in southern Oman. The main objective was pump-off control to avoid fluid pound. PDO soon realized, however, that just shutting down the pump was not the optimum solution. Transmitting the pump status information to production operators and analysts to quickly diagnose problems would lead to faster, more effective corrective action. This would reduce the need for staff to drive around looking for problem wells. Hence, the system was updated and enhanced, using the SOFS, real-time computer-assisted operations (CAO) system. SOFS runs on Hewlett-Packard’s HP 9000 workstations, and now NT-based PCs, with data gathered automatically and transferred in real-time to manned operations coordination centers, and to engineers in the head office for analysis and interpretation. The supervisory pump-off control application enables real-time monitoring, control and optimization by gathering load and position data from the pumps, and converting the data to downhole conditions. Generated plots indicate downhole pump condition, traveling valve problems and tubing movements. The module also reports and flags run time and pump cycle deviations, and wells off production. It provides remote start / stop of individual wells or groups of wells, and RPC parameter adjustment. Reports generated show rod loading — loads imposed on the pumping unit and estimated pump efficiency — based on comparing well test rates and calculated pump displacement. Fig. 4, shows a surface card (load vs. position) and a downhole card for a beam-pumped well. The surface card is measured by sampling load and position data 20 times/sec. during the pump stroke. The downhole card is calculated by the dynamic downhole pump model. In the case shown, the well is pumping normally with a full barrel. The beam pump application is also used for on-line beam pump design and prediction. For example, effects of improved rod designs, or new pump sizes, speeds or stroke lengths, can be evaluated on-line. Basic design data is entered, and the software derives the surface pump card, downhole pump card and torque. This allows an engineer to determine optimal beam pump designs that maximize production and minimize maintenance. Additionally, the system includes a common well test application with real-time links to the beam pump module. To be sure that pumps are suitable for testing, these links check well status before the well goes on test. Similarly, if a pump problem develops during the test, it will be detected and the test can be stopped. At the end of the test, pumping time is accurately calculated, and pump diagnostic cards are automatically gathered and analyzed. Historic well test information is integrated to help evaluate results. In cases where beam-pumped wells are producing little or no gas, gross flow can be derived from on-line measurement of mass flow. Using measured density and known water and oil densities, watercut can be established, allowing automatic and continuous calculation of net oil. PDO initially applied this technology to a small number of wells. Production before and after installation of the software was carefully benchmarked. Sufficient gains were confirmed to justify expanding the technology to all of PDO’s 900 beam-pumped wells. Experience to date indicates a 5% increase in sustained production, resulting from early recognition of problems, remote start-up capability and fewer mechanical failures. Additional benefits include a 35% increase in mean time between pump failure, reduced power consumption and more effective use of manpower. A key benefit has been a reduction in the need for operators to visit remote wellheads. This has improved safety through less driving and less exposure of people to hazards. Gas Lift Following successful application of CAO technology to beam pumps, PDO applied similar concepts to its gas-lifted wells in Yibal field. About 55% of PDO’s 840,000-bopd production is gas-lifted. An output gain of up to 5% is expected from the suite of gas-lift optimization programs. Yibal field was chosen as the pilot area for the gas-lift optimization program, because it is PDO’s largest field. Yibal has 320 vertical and horizontal wells, producing more than 230,000 bopd and using more than 200 MMcfd of lift gas. Gas-lift performance models were constructed for each of the wells using WinGLUE, a PC-based Windows version of the Shell-developed, gas-lift user environment (GLUE) program. The WinGLUE program was selected as the standard for gas-lift surveillance, because it provides a level of integration and functionality superior to other commercially available programs. In WinGLUE, a complete data profile for each well can be accessed for well surveillance optimization or design changes. The program’s primary benefit is its ability to match the production pressure model to reflect the actual flowing pressure gradient survey, and gas-lift valve opening and closing pressures. Having matched the model to actual field measurements, lift gas performance curves can be generated for all wells. From these, a lift gas distribution run is made to provide an optimum field production rate for total lift gas availability. A relatively autonomous subset of Yibal field was chosen as a pilot site. Electronic instruments were installed to measure gas-lift injection pressure and flow, and tubing head and casinghead pressures. Also, bulk lift gas flows and pressures were electronically measured for all supply and offtake points. All remote real-time signals were routed back to the manned operations, control center computer. During a 10-month period, 52 wells were reviewed and optimized through changes to lift rates, valve settings or completion strings. A critical success factor for the pilot was the ability of gas-lift algorithms generated by the software to optimize wells, both individually and collectively. The collective aspect provides a real-time open-loop or closed-loop control system that can automatically distribute lift gas to individual wells while monitoring system gas supply and demand. Once each minute, the system samples field data to automatically determine the status of the gas-lift distribution system. If there is an imbalance caused by a significant change in either supply or demand, the system re-allocates current supply to the wells. It does this by determining the appropriate amount of lift gas to inject into each producing well to optimize production with the current level of gas availability. The Yibal pilot included collective gas-lift system monitoring. Control and optimization were achieved by keeping the gas-lift system in balance during compressor or flow station upsets, or during normal operational fluctuations, such as variations in compressor efficiency caused by ambient temperature changes. Lift-gas wastage had been observed throughout the pilot area, but it was reduced by optimizing the gas supply distribution across the entire field, and by keeping lift-gas distribution under the operator’s control at all times. The operator had the option of either automatic allocation based on one of several available optimization methods, or direct manual allocation. Under automatic control, the gas-lift system pressure is kept to within ±1 bar. The two primary gas-lift allocation methods are based on either changes in rate or changes in pressure. For the first method, several add-on extensions are included for fine-tuning to maintain stable system pressure. Individual gas-lift wellhead monitoring and control were fostered by providing intelligent wellhead monitoring and alarm capabilities, and by maintaining pressures within operating limits to keep both the entire system and individual wells stable. Exception reporting was used to monitor individual wells. This allowed the operator to concentrate on problem wells and rapidly identify candidates for further well work. Increased production resulted from efficient identification, diagnosis and correction of deviant lift behavior. Definite gains resulted from having on-line information. Most of these were time-related, in that data was available immediately to enable the necessary corrective action. The Yibal gas-lift pilot achieved a 5% acceleration in oil production, using 10% less lift gas. Based on this success, PDO decided to apply the same solution to all of Yibal field. It has served successfully for over one year, so PDO is now applying the optimization program to all its Omani gas-lifted wells. Fig. 5 shows the gas-lift performance plot for a continuous, single-string gas-lift well in Yibal field. The gas-lift distribution (line) pressure is very stable, as is the gas-lift injection rate. However, the well is producing unstably, as indicated by fluctuations in the injection pressure and production pressure that cycle about once per hour. As can be seen from the production pressure, the well actually stops producing in between heading cycles. This is very inefficient and requires corrective action. This well has a known leak that needs to be addressed. Fig. 6 shows several variables for the total Yibal field lift gas supply, including system pressure and net lift gas supplied to the wells. The field contains 320 continuous gas-lift wells, and the primary objective of the gas-lift delivery system is to maintain stable system pressure. ESP Optimization Real-time artificial lift optimization also has benefited PDO’s ESP wells, by enabling them to produce at or near capacity, with minimum downtime and reduced capital and operating costs. For the ESP wells, real-time data is available to the operator in displays, trends and reports designed to aid problem diagnosis. For example, a combined pump and well lift performance index (LPI) is used to quickly identify the status of the total ESP system. LPI trends indicate impending deviations from normal operations. To identify sub-optimal production, LPI also facilitates comparisons of ESPs in the same field and from field to field. The software recognizes pump upsets or failures and automatically captures detailed information coinciding with the incident. This can be replayed later to help with problem diagnosis. Much of this data is used to help design, or redesign, the installation, so that when a new pump must be installed, it will match downhole conditions better. This will increase ESP productivity, efficiency and lifetime. Fig. 7 shows the performance of an ESP-pumped well. The upper curve is the manufacturer’s theoretical pump performance curve, based on the pump specification, number of pump stages and operating frequency. The lower curve is the actual pump performance curve based on the measured head (from measured downhole pressure) and production rate (from a well test). The horizontal parallel lines show the theoretical head loss, and the vertical parallel lines show the theoretical deferred production. The straight line, trending to the upper right on the plot, is the well’s inflow performance relationship (IPR) curve. The solid line, curving to the right, is the break horsepower curve. PDO has now applied this optimization technology to more than 200 ESP pumps and expects 3%
acceleration in oil production, as well as increased pump life.
The authors
Copyright © 1999 World
Oil |
 Ron
Cramer works on project managing and marketing
systems for oil field automation and management at Shell Services International in Houston.
Previously, he worked for Union Carbide and Polysar in research and process areas, and for
Shell International in the areas of oil field automation and production systems. Mr. Cramer
holds a BS degree in chemical engineering from Strathclyde University and an MS degree in
chemical engineering from Waterloo University.
Ron
Cramer works on project managing and marketing
systems for oil field automation and management at Shell Services International in Houston.
Previously, he worked for Union Carbide and Polysar in research and process areas, and for
Shell International in the areas of oil field automation and production systems. Mr. Cramer
holds a BS degree in chemical engineering from Strathclyde University and an MS degree in
chemical engineering from Waterloo University. Cleon
Dunham helps to direct oil field automation
development for Shell International Exploration and Production B.V. (SIEP) in the
Netherlands. Since joining Shell Oil Co. in July 1964, he has held various engineering and
operations assignments. Mr. Dunham earned a bachelor’s degree in agricultural
engineering from Cornell University.
Cleon
Dunham helps to direct oil field automation
development for Shell International Exploration and Production B.V. (SIEP) in the
Netherlands. Since joining Shell Oil Co. in July 1964, he has held various engineering and
operations assignments. Mr. Dunham earned a bachelor’s degree in agricultural
engineering from Cornell University.  Alley
Al-Hinai is head of computer-assisted operations at
Petroleum Development Oman. He has worked in various capacities with PDO since 1975. Mr.
Al-Hinai holds a BS degree in computer science from the University of Colorado at Boulder.
Alley
Al-Hinai is head of computer-assisted operations at
Petroleum Development Oman. He has worked in various capacities with PDO since 1975. Mr.
Al-Hinai holds a BS degree in computer science from the University of Colorado at Boulder.
