Toward a net-zero future: Decarbonizing upstream operations
Hydrocarbons have powered economic growth for 150 years, but their emissions are destabilizing the earth’s climate. Now that the atmospheric impact of fossil fuels is widely recognized, the sector is under increasing pressure. Policymakers, investors and society are pressing for change, threatening operators’ licenses to operate.
Operators have responded with strategic convening and conspicuous investments in innovation and diversification. Yet they have barely begun to address the 4.1 Gt CO2e of emissions—almost 10% of all anthropogenic greenhouse gas—created every year by their own operations, two-thirds of it from upstream operations.1
Technologies to decarbonize the extraction and production of hydrocarbons already exist, and many are economically viable, yet the sector’s atmospheric emissions continue to rise.2 This article explores why there has been little change so far, and shows how, with a bold vision and the determination to act, the oil and gas sector can step on a different path, an energy pathway that can contribute to limiting the rise in average global temperatures to 1.5°C.
A TRIO OF EMISSION-INTENSITY DRIVERS
Studying the emission intensity3 of upstream oil and gas assets reveals that three structural factors drive their “well to pipe” emission intensity.
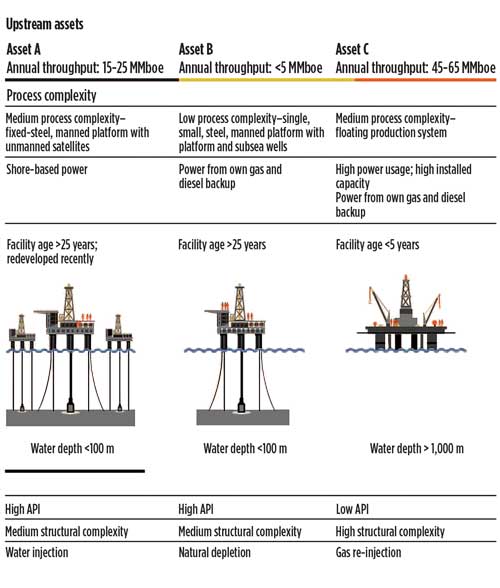
First: resource complexity structurally sets an asset’s emission intensity. All else being equal, the least emission-intensive assets are large producers with high API gravities and low reservoir complexities.4 The data show that assets with an API gravity of 20° or less can be, on average, three times more emission-intensive than those with API gravities of 50° or more. Assets with the highest structural emission intensity in our data set are complex reservoirs: viscous, in deep or ultra-deep water, compartmentalized, or high pressure and temperature.
Pressure maintenance during primary production or secondary and tertiary recovery also can increase energy and emission intensity. Simulations of GHG emissions from oil production show average emissions doubling over 25 years.5 In the IEA’s terminology, these are resources with intrinsically low energy return on energy invested (EROI).
Second: processes and engineering are crucial, controllable drivers. Complex facilities are typically more energy-intensive, and therefore more emission-intensive. Hub platforms with more equipment and personnel require more energy for running core and auxiliary systems, while high manning levels intensify their logistics, which again increases emissions. A small single-steel-jacket platform is less emission-intensive than an FPSO with complex subsea export infrastructure connecting many complex wells.
Operations benchmarks—and our emission data—both show that the age of a production facility does not limit operational performance. However, older assets face more complex challenges in reducing emission intensity. Older equipment may be less efficient and economically challenging to replace. Aging production facilities may also suffer from higher fugitive emissions, as wear parts degrade. On the other hand, process design choices can help offset the challenges of maturity.
Third: routine flaring and venting, if prevalent, can contribute 40% of the carbon intensity of hydrocarbon production in a region.6 In jurisdictions where venting and flaring are still common, such as Russia, Iran, the United States, Algeria and Nigeria, oil facilities with high gas-to-oil ratios and few export or recovery options will routinely flare or vent the associated gas, emitting large volumes of CO2, some methane, and other volatile organic compounds (VOCs). More widely, fugitive emissions and intermittent flaring and venting materially increase upstream methane emissions, which account for 34% of oil production emissions and 41% of gas production emissions, assuming 100-year global-warming potential.7 This waste is a problem, but its mitigation presents an economic opportunity.
THE PATH TO DECARBONIZATION
In the short term, the structural drivers of emission intensity seem to limit the freedom that upstream leaders have to reduce their atmospheric emissions. For producing assets, these constraints appear to be the hand they have been dealt. However, operators can choose how to play this hand, giving them more ways to reduce emission intensity than at first appear.
Our benchmarks show that raising operational performance has a large impact on emissions. And 90% of known technological solutions to decarbonization are within the grasp of operators at a cost of no more than $50/metric ton of carbon.8
We describe three levers to reduce emission intensity across the full spectrum of scope 1 (direct) and scope 2 (indirect) emissions from upstream oil and gas operations, Fig. 1. The first, indisputable, step is optimizing operations—maximizing stability and uptime reduces intermittent flaring and venting, and requires few major process changes. Second, sustainable design choices are now available for deployment and increasingly present a positive economic benefit. Third, producers must start to balance their portfolios across resources with a spread of emission intensity, in anticipation of the risks from future policy scenarios and investor choices.
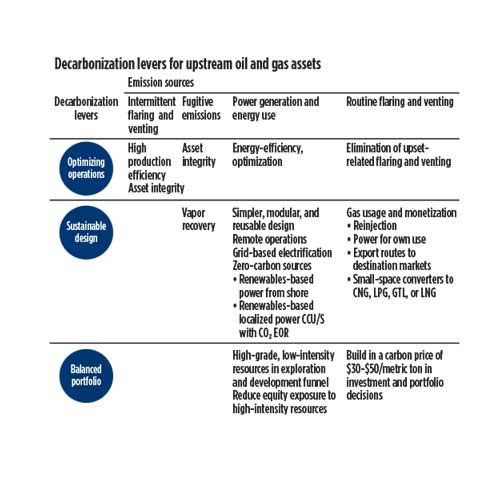
The first decarbonization lever: Optimizing operations. Operating a well equals operating responsibly. Above all, it is an economical first step in reducing intermittent flaring and venting and fugitive emissions, the third-biggest source of emissions. Our analysis shows that across a global sample, once you correct for structural factors, assets in the top decile of production efficiency have the lowest emissions in the sector, based on the stability of their operations. The best can achieve less than 7 kg/boe, whereas assets in the third quartile emit at least three times as much.
To catch up, lower-performing assets must address three areas. First, resolve repeat failures that cause process trips or shutdowns. The flaring or venting of methane and other VOCs as equipment is depressurized for safe maintenance, and restart leads to high-emission intensity. Second, ensure operating parameters have not diverged significantly from the design envelope, due to changes in fluid rates and properties. For example, pumps not running at their best efficiency point not only use more energy, but are also less reliable, both of which lead to higher emissions. Third, find and fix asset-integrity issues that increase fugitive emissions, such as degradation of flange joints, valve glands, or seals.
All three areas can be addressed within current operating models and are the core components of traditional levers to improve operational performance. We observe, on average, that a 10% increase in production efficiency delivers a 4% reduction in emission intensity, all else being constant. Maximizing stability and integrity may require upgrades of process, controls and parts. A less capital-intensive route is to leverage data and advanced analytics to help optimize and stabilize operations. Predictive maintenance and automated condition-monitoring can reduce planned interventions and extend runs, improving stability and reducing emissions. Advanced analytics enable the next level of energy efficiency, isolating operating parameters that minimize power per unit throughput.
The second decarbonization lever: Sustainable design. There are multiple sustainable design options to make processes less emission-intensive. However, their use is not yet routine: traditional investment stage gates weight up-front capital costs over other considerations, such as energy efficiency or cost-to-operate. With total life-cycle value as the target function, operators may be more motivated to explore sustainable design. Doing so, using proven technologies, can not only reduce operating costs, but also generate new revenue streams.
Monetizing wasted gas. By some estimates, 257 Bcm of natural gas—equivalent to nearly half the consumption of Europe—is wasted globally in flares, vents and leaks. If monetized, this could generate nearly $40 billion of revenue globally.9 New ventures, such as Capterio, improve data transparency around flaring and install bespoke technological solutions that monetize the gas. Solutions include reinjecting to enhance recovery or disposal; power generation (for own use or grid export); building export routes to destination markets; or installing small-scale converters to create products, such as CNG, LPG, GTL or LNG.
Reducing energy demand. Energy costs (including opportunity costs) are close to 15% of total production costs; recent work with upstream operators suggests they can save up to 20% in energy usage. This makes a compelling business case, with a total prize of up to $10 billion in cost reduction per year for the upstream industry. Modular unmanned installations around a supporting hub, as Norway is building in the NOAKA area, or better still, linked to a remote operations center, are gaining traction. Simpler, modular and reusable facilities with low equipment counts and manning levels reduce costs and emissions from energy use and logistics.
Using zero-carbon energy supply. Sustainable sources of energy improve conversion efficiencies or generate revenue. Offshore, grid-based electrification was first shown to be viable in 2003, when the Abu Safah development, 50 km offshore Saudi Arabia, started up with a connection to the main grid. More recently, newly commissioned Johan Sverdrup field is powered from shore, even though it is 140 km from Stavanger at a water depth of 110 to 120 m.
For more remote platforms, localized renewables generation offers a sustainable design option. Platforms in both the southern North Sea and Norwegian sectors, for instance, have introduced zero-carbon power sources, with conventional backup, for stand-alone facilities. To improve the economics of their deployment, operators might supply power to clusters of their own and third-party offshore facilities.
Removal through carbon capture, usage and storage (CCU/S). CCU/S is an increasingly popular decarbonization option, as seen on the Norwegian Continental Shelf. An encouraging example of CCU/S collaboration across the industry is the renewed Northern Lights project. When combined with CO2-enhanced recovery, it improves recovery rates in a closed-loop CO2 system and raises both production and emission performance.
The third decarbonization lever: Balanced portfolios. The demands of policymakers and investors are fast-evolving. Credible scenarios show shareholders reducing their exposure to high-emitting resources, freezing out operators that hold the highest-intensity assets. There are also credible scenarios, in which policy and markets accelerate peak oil demand to 2025, thereby raising the cost of capital and making oil and gas unattractive as investments for growth.10
Integrated oil company portfolios have tilted toward natural gas over the past few years, attracted by its reputation as a transition fuel. More recently, Equinor has announced an ambition to meet a carbon-intensity target of 8 kgCO2e/boe by 2030. Other producers have set emission-reduction targets at varying levels. Bold visions must recognize that the highest-emitting reservoirs are nearly three times more emission-intensive than the lowest-emitting ones. What follows is a set of choices for upstream leaders to make regarding their fields—development plans, resource funnels, and portfolios.
Field-development plans need to weigh recovery factor against the emission performance of different production and pressure maintenance techniques. Likewise, building portfolios with better emission performance would involve high-grading only the lower-intensity resources, or those for which sustainable design can fully offset the emission implications of resource complexity.
Critical factors are viscosity, water depth, distance from shore, initial pressure, and depletion. If emission intensity were always a decision criterion, or a $50/metric ton carbon price were imputed in shaping resource funnels, investment committees would favor “advantaged” resources—those with higher API gravity, in shallow-to-medium water, or requiring conventional production techniques. Or they might limit offshore investments closer to shore, to enable grid-based electrification. The value equation fortunately boosts balanced portfolios: break-even economics of many reservoirs with high-emission intensity are marginal at more than $65/bbl.
A STRONG START: FUNDAMENTALS
Upstream leaders aspiring to reduce emissions must first overcome uncertainties in understanding the emission performance of their assets and portfolios: what is really driving emissions, which emission sources to tackle urgently, and by how much. We respond to this baselining challenge by drawing on the McKinsey Upstream Energy & Emissions Index (MUEEI), a proprietary upstream energy and emission index of assets of different types, and at different life stages. The index brings both consistency and detail, which enable operators to separate the controllable factors in emission intensity across the oil and gas lifecycle from the external ones. The following sidebar explains the methodology, using a global sample of offshore assets, and illustrates how to apply the MUEEI in assessing current emission performance and in setting reduction targets.
How clean could my assets or portfolio be? The McKinsey Upstream Energy & Emissions Index (MUEEI) responds to the challenge of detailed insight into the magnitude and causes of emissions by drawing on proprietary operational and emissions data for different upstream assets. The underlying analyses use a multivariate regression of the energy and emission intensity of upstream assets, based on factors such as size, technology and complexity—carefully calibrated using engineering first principles—to assign a unique score to every upstream asset. One way to interpret the index value is “predicted emission”: what is the emission score of an upstream asset, considering both resource and process factors?
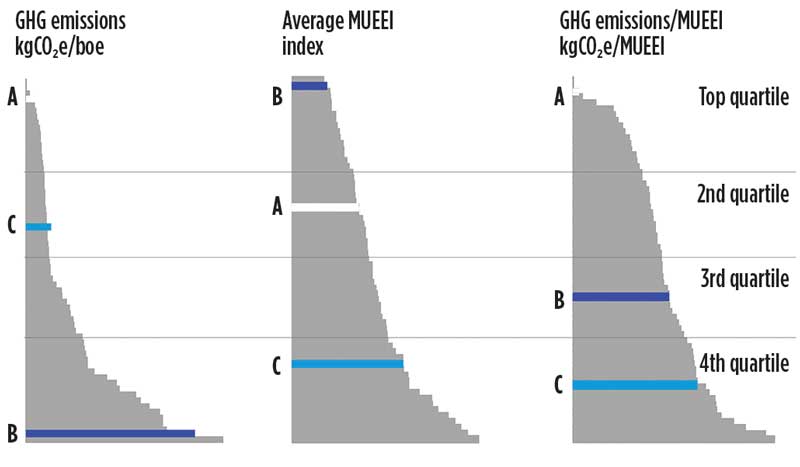
How does the MUEEI compare with emissions measured in kgCO2e/boe? The most common performance indicator measures upstream atmospheric emissions per unit of production. It gives good insight to operators on how clean each barrel is that they produce from the assets under their stewardship. However, the relationship between production and emissions is not linear (some emissions from an installation are fixed, regardless of production volumes), and kgCO2e/boe favors large producers and penalizes mature ones.
We replace production with the MUEEI as the denominator in the equation. Normalization by the index helps size the emission-reduction opportunity at any upstream asset, relative to the lowest emitters and traces back to the areas to address across structural and operational drivers.
In Fig. 2, Asset C, a large early-life producer, is in the second quartile on a per-unit-of-production basis, but in the fourth quartile when normalized by the MUEEI. Despite a high predicted-emission score, based on its resource and process complexity, Asset C has a sizable gap to top-quartile emission performance—within the boundaries of its current production techniques, Asset C would have to reduce its emissions by 40% to 50% to match top-quartile emission performance.
Asset B, on the other hand, is a mature asset and in the bottom quartile on a unit-of-production basis. A simple manned platform with only several platform wells and subsea wells, Asset B has a low MUEEI score—if its operator aimed to achieve top-quartile emission performance, a 30% reduction in absolute emissions would have to follow.
Finally, Asset A is in the top quartile, when normalized by both production and the MUEEI. Design and operating choices have helped offset the implications of resource complexities.
In addition to setting a realistic emission-reduction target for an asset, the MUEEI can be easily extended to assess the emission exposure of portfolios (Fig. 3) or the predicted emissions from a funnel of new resources or projects.
From this, upstream leaders can move on to the question of what to do, defining clear choices to reduce the emission intensity of their upstream assets and portfolios. Multiple technologies and options come with complex trade-offs between abatement and value. Solutions are bespoke, reflecting an asset’s individual structural characteristics. A light crude with a simple process and no routine flaring and venting would target intermittent emissions and energy use. A heavy crude with routine flaring must address multiple emission sources in parallel.
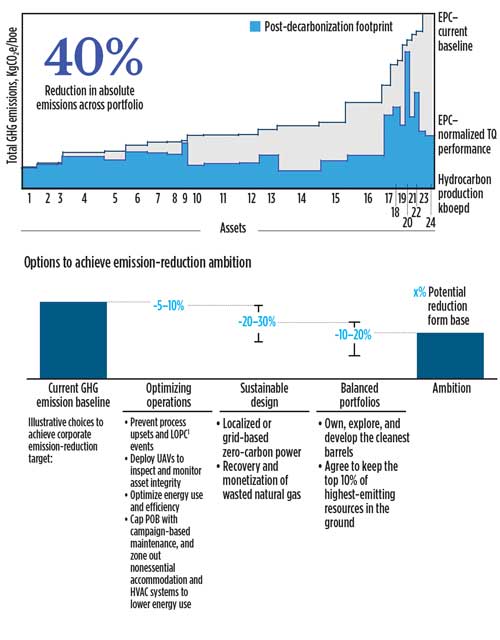
Fig. 3 uses the emission-performance curve for a large upstream producer’s offshore portfolio to illustrate the total emission reduction required to match top-quartile performance for each asset. It also shows the overall portfolio alongside reduction choices to consider in achieving the target.
To facilitate and advance these choices, three fundamentals must be in place:
- Target setting and performance transparency to set realistic but ambitious reduction targets (Fig. 4) for the portfolio and its constituent assets; and track improvements, based on a robust baseline of anthropogenic greenhouse-gas emissions. Traditional methods of measurement, based on assessing gas concentrations and readings from process-emission controls, would need to be supplemented with mobile methane detection-and-monitoring technologies for fugitive emissions and satellite-based monitoring of flares, to improve the accuracy and completeness of performance tracking.
- Rigor in evaluating emission-reduction initiatives. Standard abatement-cost-and-impact calculators clarify trade-offs between profitability and societal license to operate. And they enable executives to apply new decision criteria, such as total life-cycle asset value, adjusted for an imputed carbon price.
- Robust execution and performance tracking, so that innovation and implementation keep pace with investor and public sentiment; such an infrastructure would not only aim to bring discipline in execution but also accelerate intra- and cross-operator learning to get the cycle of improvement going more rapidly. Emission-reduction programs are no different from operations transformations: leaders must energize their organizations with a bold vision to deliver change.
Over the years, upstream operators have responded to market and technological disruptions with innovation and resilience. With an accelerated energy transition, they must do so again. As the imperative of a net-zero emission future becomes even clearer, oil and gas companies can mitigate the structural emission intensity of their operations through balanced portfolios and sustainable design. And the case for cleaner production operations becomes a stronger imperative than ever.
ACKNOWLEDGMENT
The authors wish to thank Dan Cole, Adam Davey, William Healy, Runo Mijnarends, Mark Thomson, Francesco Verre, Stacey Wilding and Thanusaan Yogeswaran for their contributions to this article.
REFERENCES
- McKinsey Sustainability Insights.
- “Environmental performance indicators—2017 data”; International Association of Oil & Gas Producers.
- McKinsey Upstream Energy & Emissions Index data and insights.
- American Petroleum Institute gravity, a measure of how light or heavy a crude is relative to water: heavy crudes have lower APIs and are more energy-intensive to extract.
- Mohammad S. Masnadi and Adam R. Brandt, “Climate impacts of oil extraction increase significantly with oilfield age,” Nature Climate Change, Vol. 7, August 2017.
- Mohammad S. Masnadi, et al, “Carbon intensity of crude oil production,” Science, August 2018, sciencemag.org.
- IEA, World Energy Outlook 2018.
- McKinsey Sustainability Insights.
- Includes 145 Bcm from flaring and 112 Bcm from venting and leaks; Mark Davis, “Monetising flared gas … innovative applications of proven technology,” September 2019, eprg.group.cam.uk.
- Global Energy Perspective 2019, McKinsey.com; Namit Sharma, Bram Smeets, and Christer Tryggestad, “The decoupling of GDP and energy growth: A CEO guide,” April 2019, McKinsey.com.
- Coiled tubing drilling’s role in the energy transition (March 2024)
- Advancing offshore decarbonization through electrification of FPSOs (March 2024)
- Digital tool kit enhances real-time decision-making to improve drilling efficiency and performance (February 2024)
- E&P outside the U.S. maintains a disciplined pace (February 2024)
- U.S. operators reduce activity as crude prices plunge (February 2024)
- Drilling advances (January 2024)

