Enhanced oil recovery improved by nanoparticle-induced crude swelling
Current oil recovery methods with existing technologies are not satisfactory, and, depending on reservoir characteristics, an average of 50% of crude is left behind. Several enhanced oil recovery (EOR) methods have been investigated and proposed for field-scale implementations. The most widely studied EOR methods are based on surfactants, polymers, alkalis and their combinations as injection fluids.
EOR surfactants work on the principle of reducing interfacial tension (IFT) between crude oil and water, which helps to increase the capillary number and reduce residual oil saturation. Similarly, polymers also amplify the capillary number by increasing the viscosity of the injected fluid, which ultimately improves sweep efficiency.
However, conventional methods are not entirely adequate, due to poor recovery efficiency and the high cost of chemical injection, due primarily to shear degradation and excessive adsorption on rock matrix. Hence, a more efficient and economic EOR method is required.
ALTERNATIVE EOR TACTIC
Nanoparticle (NP)-based EOR (nano-EOR) is an alternative strategy. Nanoparticles, due to their relatively small size, large surface area and high surface charge density, have the potential to increase recovery efficiency at lower concentrations than conventional chemicals. Researchers globally have been studying various nanoparticles to assess their potential in EOR. Sustained efforts in the last several years have resulted in the discovery of several novel EOR mechanisms for nano-EOR such as: disjoining pressure log-jamming, wettability alteration, reduction of interfacial tension (IFT), viscosity enhancement and crude oil viscosity reduction.
Unlike surfactants and polymers, it is evident that there is no single, universally accepted mechanism for nanoparticles-enabled EOR. Although many mechanisms of nano-EOR have been proposed, a lack of direct connections between the pore-scale mechanisms and the macro-scale oil recovery performance makes it hard to determine which mechanisms are dominant. Nanoparticles are also increasingly studied for addressing key challenges to supplement conventional EOR methods by reducing surfactants adsorption, increasing polymer viscosity and reduce shear degradation. Therefore, it is important that a mechanism for nanoparticle-enabled recovery be identified, and pore-scale physics be validated and expanded in the pore-networks on a micro-model, then performance-validated in the reservoir core.
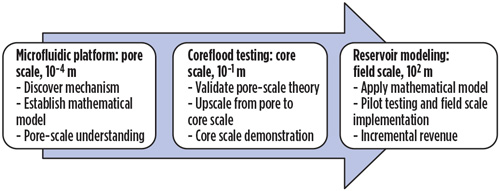
In this work, the authors have discovered a novel phenomenon of nanoparticle-crude oil interaction at the pore-scale, Fig. 1. Multi-scale experiments were conducted to connect this pore-scale phenomenon’s role in oil recovery performance. Pore-scale (10–4m) study was conducted on a dead-end-pore micro-channel, and pore scale physics were identified, which was further expanded in the pore-networks on a 2.5-D micromodel chip (10–1m), and performance was validated in the core-scale inside an outcropped Idaho Gray rock-sample (10–1m) on a core-flooding setup.
EXPERIMENTAL PROCEDURE
Materials. A spherical-shaped hydrophilic silica nanoparticle (HSN) was used in this study. Artificial seawater (ASW) was used as a brine phase. ASW was prepared in the laboratory by mixing salts in deionized water to obtain the following composition (grams/kg): Na+ 10.764, K+ 0.387, Ca2+ 0.406, Mg2+ 1.297, HCO3–0.142, Br– 0.066, Cl– 19.353, SO42– 2.701 and H3BO30.026.
Light sweet crude oil (API:28, viscosity: 5 cP@80°C) was used as model crude oil in the study for
microfluidics and core-flooding experiments. Idaho Gray core samples were purchased and used in the core-flooding experiment.
METHOD
Nanoparticle size and zeta-potential measurements. The particle size and zeta-potential measurements were conducted on a Malvern Zetasizer instrument, using dynamic light scattering and laser Doppler micro-electrophoresis techniques. A cuvette containing the HSNs suspension was placed in the sample chamber of the instrument. In the suspension, particles move randomly, due to the Brownian motion. DLS measures the diffusion of particles and converts it into particle size and particle size distribution, using the Stokes-Einstein equation.
For zeta-potential measurement, HSNs suspension filled in the folded capillary cell was placed in the instrument sample compartment, where an electric field was applied through it. Nanoparticles in the presence of the electric field moved with the velocity, which was related to their zeta-potential. An instrument, by means of phase analysis light scattering, measured velocity and used that velocity to calculate zeta-potential. Mean diameter and zeta-potential were measured as 15 nm and (–)32 mV, respectively.
Microfluidics setup design. The microfluidics set-up consisted of syringe pumps, a microscope equipped with a camera and light source, a low-range sensitive transducer, syringes, tubing, connectors and micromodels. Two different micromodels, called dead-end pore microchannel and 2.5-D micromodel, were used in the microfluidics experiments.
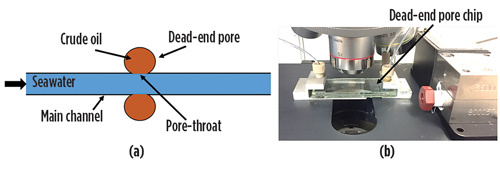
Dead-end pore microchannel design. A pore scale oil recovery experiment was conducted on the dead-end pore microchannel. The dead-end pore glass microchannel consisted of pores connected to a main channel through a 3-D throat. The pore diameter was 230 µm, the width of the throat was 33 µm, and the minimum depth of throat was 6 µm, Fig. 2a.The protocol was similar to a typical crude oil recovery experiment. Initially, oil was injected through the syringe pump to completely saturate the entire main channel and both the dead-end pores. Aqueous phase at a very low flowrate (0.1 ml/hr) was injected to displace the crude in the main channel, and to trap crude oil in dead-end pores (Fig. 2a). Following this, HSNs suspension at 0.1ml/hr was injected into the main channel, and the trapped oil’s evolution during the HSNs injection was captured by a microscope, Fig. 2b.
Porous micromodel (2.5-D reservoir-on-chip) design. The porous micromodel consisted of a 2-D arrangement of 104 interconnected 3-D pores in a glass framework. Each pore in the micromodel was comprised of a pore body and four pore throats. The depth of pore bodies was 22 µm, each of which was connected to the four nearest neighboring pore-throats, each having a 6 µm depth and 33 µm width. The distance between the centers of neighboring pores was 200 µm. Total pore volume was 4.4 µl and the liquid permeability, as measured on a microfluidics setup, was 1,100 mD. The fluid injection sequence was like the one used for a dead-end pore microchannel experiment. Initially, the micromodel was saturated with seawater, which was displaced by injecting crude at a flow rate of 9 µl/hr (4 ft/day) to achieve connate water and initial crude oil saturation in the pores.
ASW at this point was injected at a flowrate of 9 µl/hr (4 ft/day) as secondary flooding agent to displace oil. ASW injection displaced crude from the pores toward the outlet. ASW injection was intentionally done for a longer duration, to make sure crude oil was no longer recovered at the outlet. HSNs suspension was injected at this stage, to displace oil that was not recovered from the micromodel during prolonged ASW injection. Images from the top were captured at regular intervals throughout the injection process, and they were analyzed on open-sourced software to determine the amounts of crude and ASW present in the micromodel. These data were then used to calculate the percentage of oil recovery as a function of time during the experiment.
Core-flooding setup design. The core-flooding setup consisted of a hydrostatic core holder for confining core sample; a vacuum pump for removing air from the core; floating piston accumulators and injection pumps for injecting ASW, crude oil and HSNs fluids into the core. It also included a mineral oil pump for applying overburden pressure, and a fraction collector for collecting outlet samples at regular intervals. An Idaho Gray core sample was used for the core-flooding experiment. The core sample’s external surface was cleaned thoroughly in running deionized water, then dried in an oven at 100°C to evaporate the water until the weight of the dried cores stopped changing. Dried cores were scanned on an X-ray CT scanner to visualize core internals and ensure that they were free of abnormal defects, cracks, vugs and non- homogeneity. Following cleaning, core samples were placed in the core holder, overburden pressure was applied, and air was removed from the core. Effective pore volume (PV) was measured by injecting ASW in the core, using fluid a re-saturation method (pore volume = fluid injected – fluid collected – dead volume).
To determine permeability, differential pressure across the core was measured for different flowrates of ASW through the core. Darcy’s equation (q= (k*A*∆p)/(µ*L)) was used, in which flowrate and differential pressure are connected through core permeability. In this equation, q is the injection flowrate, k is permeability of the core sample, A is cross-section area, ∆p is the differential pressure across the core, µ is viscosity of fluid, and L is the length of the core sample. Following porosity and permeability measurement, crude oil was injected into the core until the irreducible water saturation level was reached.
The remaining amount of aqueous and oil phase in the core was determined to calculate initial crude oil and water saturation in the core. Oil-saturated core was left for 24 hr, for oil droplets to reach equilibrium. ASW was used during the water flooding phase, followed by a tertiary recovery phase during which HSNs suspension prepared in ASW was injected to displace crude oil. Recovered oil and ASW were measured, using a graduated cylinder, and plotted as a percent of the initial oil in the core.
RESULTS
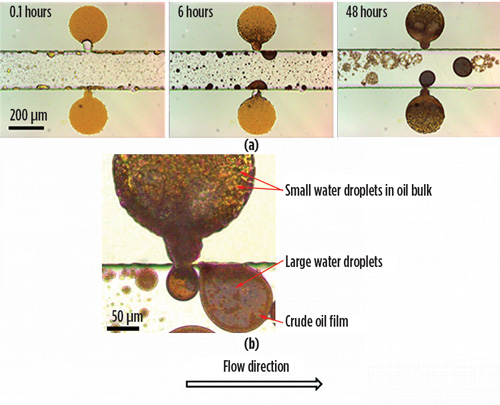
Dead-end-pore microchannel explanation. Crude oil was trapped in the dead-end pores. Some of the crude also was seen present on the channel walls. Five-weight percent HSNs suspension in DI water was injected in the dead-end pore microchannel to recover oil trapped inside the two dead-end pores. Interestingly, during the injection of HSNs suspension, it was observed that oil in the pores swelled considerably and snapped-off into the main channel, in the form of oil drops, Fig. 3a. The crude oil present on the main channel surface also swelled very significantly, and ultimately was removed from the surfaces and progressed left-to-right with the flow in the main channel. It also was observed that the oil affinity changed from wetting to a non-wetting phase on the glass surface. Change in wetting behavior was more evident on the main channel, where oil, initially in the shape of film, was transformed to something more like expanding drops, which indicated a significantly increased oil contact angle with the glass surface. In the dead-end-pores, the HSNs suspension was observed to be progressing inward in the two-phase (oil—glass surface) region, forming a three-phase region (oil—glass surface—aqueous phase).
The three-phase interface inward movement could be due to the formation of a nanoparticle layer in-between glass and crude oil, much like an inward moving wedge, with a theory of disjoining pressure. Overall phenomena possibly could be disjoining pressure-driven wettability alteration, along with oil swelling. Snapshots of the microchannel shortly after injection of nanoparticles (after 0.1 hr), and during the injection (after 6 hr) and toward the end of injection (after 48 hr), are in Fig. 3a. One of the dead-end-pores was observed under the microscope after 23 hr. Many tiny water droplets were observed inside the oil bulk, which explained crude oil swelling. These tiny droplets coalesced to form bigger droplets that were observed close to the oil-water interface at the pore throat. We defined this new system as a water-in-oil-in-water double emulsion, Fig. 3b.
HSNs suspension flooding in the reservoir-on-a-chip 2.5-D micromodel. Following the oil swelling observed on the dead-end-pore micromodel, an oil recovery experiment was conducted on the 2.5-D micromodel. In the case of a dead-end-pore micromodel experiment, concentrated HSNs suspension (5 wt%) was prepared in de-ionized water, however in the case of a 2.5-D micromodel, comparatively diluted HSNs suspension at 2,000-ppm concentration, prepared in ASW, was used as the tertiary injection fluid. ASW was used during secondary waterflooding. The goal was to identify whether there was any advantage of observed oil swelling phenomenon in crude recovery.
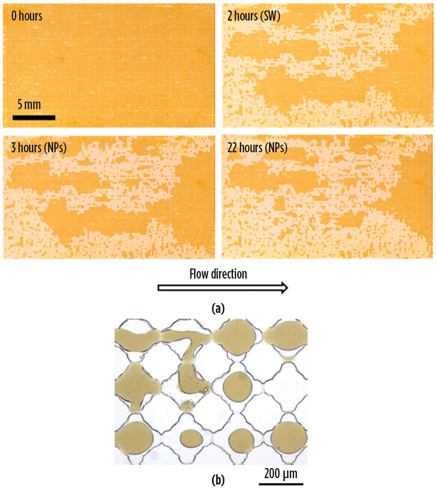
The transparent micromodel allowed us to visualize oil displacement under the microscope. Snapshots during the injection process were recorded on the Nikon SLR camera, and are shown in Fig. 4a. The image on the top left was taken initially when the micromodel was saturated with the oil, with irreducible water distributed all over the chip in a very small amount.
In the picture, the oil phase is marked dark yellow in color, and anything other than dark yellow is the ASW phase or emulsion of oil and ASW phase. The top right image was captured when the system achieved steady state after two hours of ASW flooding.
As expected, viscous fingering was observed. At the end of ASW flooding, a significantly large area of the chip was not swept at all, which resulted in a significant portion of oil not recovered from the chip. The bottom left image was captured during HSNs suspension flooding, and the bottom right image was captured at the end of HSNs flooding. It was clearly visible that HSNs suspension injection mobilized a significant amount of crude from the un-swept region. Almost no change in oil saturation was observed in the swept region, indicating that HSNs suspension did not affect residual oil.
Similar to the dead-end-pore micromodel, tiny droplets of water were observed in the oil phase, along with oil de-wetting, Fig. 4b. Generation of water droplets in the crude oil phase in this case was much less which was probably not adequate to recover any significant amount of crude from the swept region. Overall, observations on the 2.5-D micromodel were found to be very consistent with the observations on the dead-end-pore micromodel.
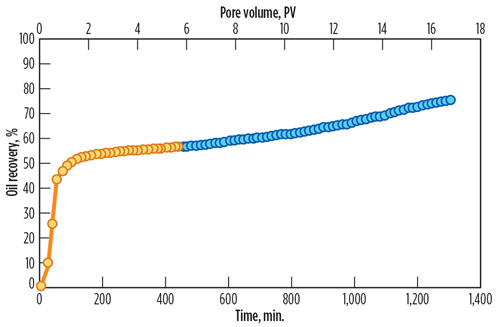
From the image analysis, quantification of crude oil recovered during ASW flooding and HSNs flooding was made. The recovery curve is shown in Fig. 5. Crude oil recovery during ASW flooding was about 33%. Injection of 2,000-ppm HSNs in ASW, after secondary ASW flooding, didn’t recover any significant amount of oil for several hours. But after a few hours, HSNs suspension started to produce oil from the un-swept region. It appears that the oil swelling required several hours to occur, as was observed during the dead-end-pore micromodel experiment. This helped to divert injected HSNs suspension toward the regions that were un-swept during ASW flooding.
The time scale for slow incremental oil recovery corresponded very well with the oil swelling and ultimate recovery observed on the dead-end-pore microchannel. Overall, 11.8% incremental oil was recovered during HSNs suspension flooding. From this experiment, we confirmed a 2,000-ppm concentration of HSNs in ASW-enhanced crude oil recovery, due to improving sweep efficiency and not by reducing residual oil saturation.
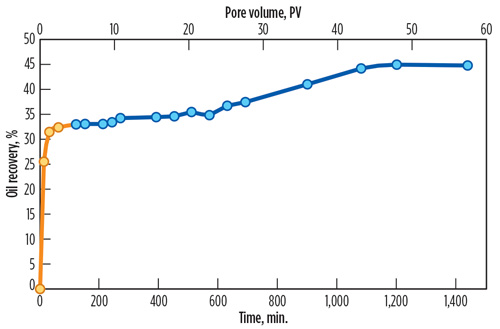
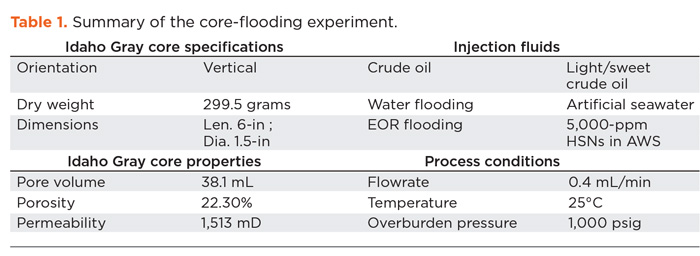
HSNs flooding through Idaho Gray core on core-flooding setup. HSNs suspension prepared in ASW was evaluated for oil recovery on a core-flooding setup, to determine whether the findings from micromodels can be applied at the core scale. The core-flooding experiment was conducted on the light-and-sweet crude oil-saturated high-permeability Idaho Gray core. Core was dried, vacuumed and then saturated with ASW. The pore volume was measured, and porosity was calculated. Following this, ASW was injected in the core, and differential pressure at different flowrates was measured to calculate the permeability, Table 1.
Crude oil injection was started in vertical orientation from the bottom to top, and the core was saturated with oil. Crude displaced ASW that was present in the core. Initially, only the aqueous phase was collected at the outlet. Oil injection was continued until there was no ASW collected at the outlet, and 100% oil was collected at the outlet. The amount of crude oil and ASW present inside the core was calculated, using mass balance. Following this, ASW flooding was started, and the crude was displaced. Initially only, oil was collected at the outlet and, afterward, ASW breakthrough occurred before one pore volume. Following ASW flooding, 5,000-ppm HSNs suspension in ASW was injected into the core, and the recovered oil was collected at the outlet.
The cumulative percentage of oil recovery with time and pore volume is plotted in Fig. 6. The percentage of oil recovery during ASW flooding was 57.1%, which went up by 19%, to 76.1%, during HSNs suspension injection. Interestingly, HSNs suspension showed slow, incremental oil recovery, and the obtained oil recovery curve is very similar to the one observed for 2.5-D micromodel confirming pore-scale and pore-network studies conducted in the micro-models co-related well with the core-flooding results.
CONCLUSION
A dead-end-pore microchannel was applied to study the trapped oil’s interaction with HSNs aqueous suspensions. Swelling of oil was observed during HSNs suspension injection, which was caused by spontaneous generation of aqueous droplets in crude. Such swelling oil was also investigated on a 2.5-D micromodel flood experiment and showed excellent conformation control performance that provided 11.8% incremental oil recovery. It was found that HSNs did not change the residual oil saturation, but improved sweep efficiency. Conformance improvement was induced by swelling oil’s occupation of swept water channels. The oil recovery curve from a micromodel flood experiment co-related with the core-flooding data. In both cases, incremental oil recovery came slowly and continuously in about 20 hr.
Compared to the core-flooding experiment, micromodel flooding can provide more in-situ and dynamic saturation information, at less cost and in a shorter time-span. Micromodel flooding could be treated as an efficient and significant supplement to core-flooding. The ultimate outcome of pore scale to core scale understanding is extremely beneficial in connecting pore scale mechanism with the core scale performance, and finally applications in reservoir simulation and successful field implementation. WO
ACKNOWLEDGEMENT
The authors would like to thank Baker Hughes, a GE company for financial support and allowing us to publish this work. We would also like to thank Dr. Matthew T. Balhoff and his research groups’ from the University of Texas at Austin for technical support in building a micromodel experiment setup. We would also like to acknowledge our colleagues at BHGE for their miscellaneous help in the laboratory. This article was derived from SPE paper 191971, which was presented at the SPE Asia Pacific Oil and Gas Conference, held in Brisbane, Australia, Oct. 23–25, 2018.
- Downhole tool integrity maximizes completion efficiency and ultimate recovery (July 2023)
- Enhancing stimulation efficiency in a fractured open-hole carbonate reservoir by diversion design using advanced modelling techniques (May 2023)
- Automated completion surface system: The path to fracturing 24/7 (May 2023)
- Advanced multi-stage completion systems maximize efficiency (May 2023)
- Casing optimization through predictive analysis optimizes frac efficiency (January 2023)
- Developing an F22, umbilical-compatible scale inhibitor for West Africa (November 2022)
- Applying ultra-deep LWD resistivity technology successfully in a SAGD operation (May 2019)
- Adoption of wireless intelligent completions advances (May 2019)
- Majors double down as takeaway crunch eases (April 2019)
- What’s new in well logging and formation evaluation (April 2019)
- Qualification of a 20,000-psi subsea BOP: A collaborative approach (February 2019)
- ConocoPhillips’ Greg Leveille sees rapid trajectory of technical advancement continuing (February 2019)

