Industry at a Glance
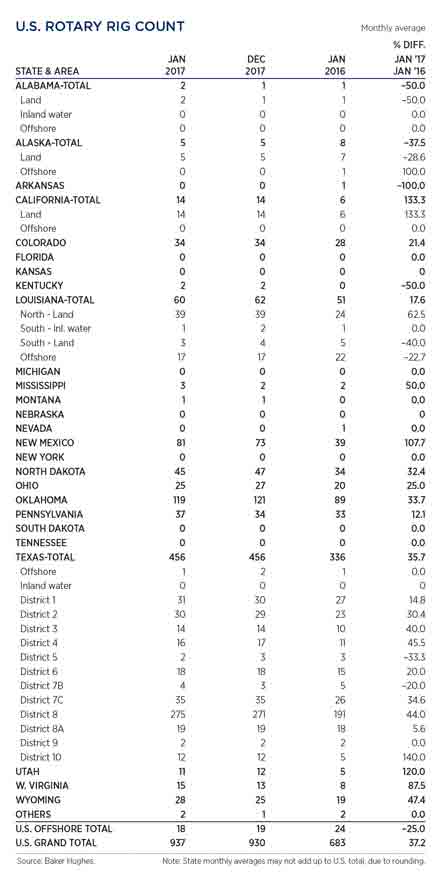
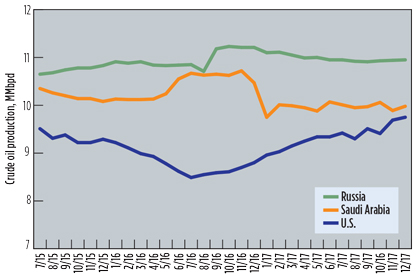
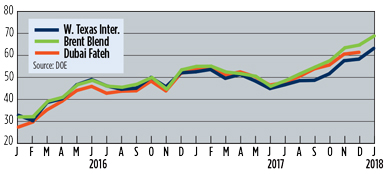
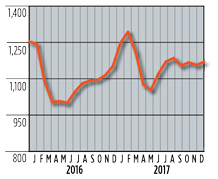
U.S. crude production surged to its highest level in 47 years, when output reached 10.038 MMbpd in November (EIA). In spite of the upswing in supply, WTI gained 8.4% to average $63.19 in January, with Brent middling at $68.80/bbl (+6.4%). OPEC has maintained production cuts, while Russia and Saudi Arabia have affirmed intentions to sustain reductions until year-end. U.S. stockpiles have continued to decline. Traders bid-up futures through 2022, the strongest backwardation cycle since 2014. The pattern is typical in times of rising demand and tightening supply. The U.S. rig count averaged 937 units in January, seven more than the previous month. However, increased efficiencies in shale fields now require fewer wells to achieve similar production. International activity averaged 1,166 rigs in December, a 2% increase.
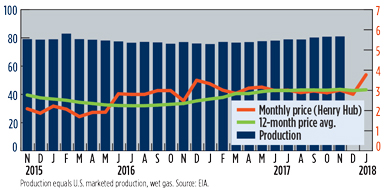
U.S. GAS PRICES ($/MCF) AND PRODUCTION (BCFD) GRAPH
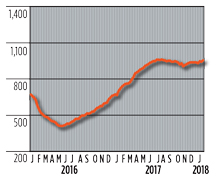
U.S. ROTARY DRILLING RIGS GRAPH
U.S. ROTARY DRILLING RIGS TABLE
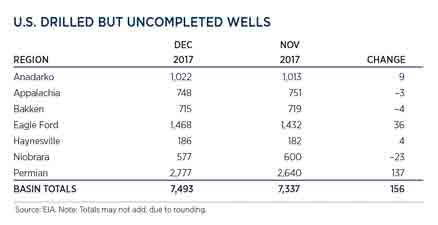
U.S. DRILLED BUT UNCOMPLETED WELLS
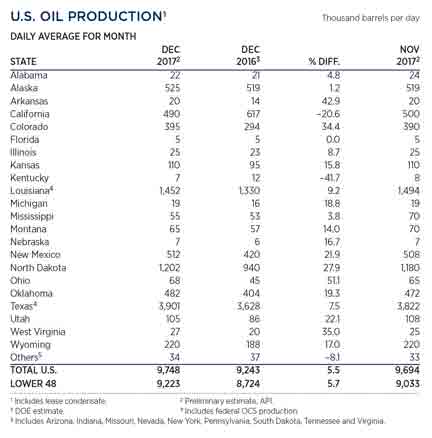
U.S. OIL PRODUCTION TABLE
WORLD CRUDE OIL PRODUCTION, TOP THREE PRODUCERS
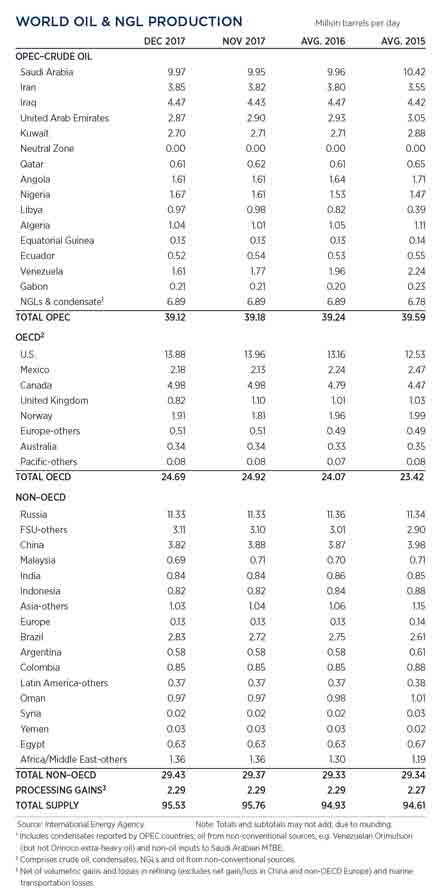
WORLD OIL PRODUCTION TABLE
SELECTED WORLD OIL PRICES GRAPH
INTERNATIONAL ROTARY RIG GRAPH
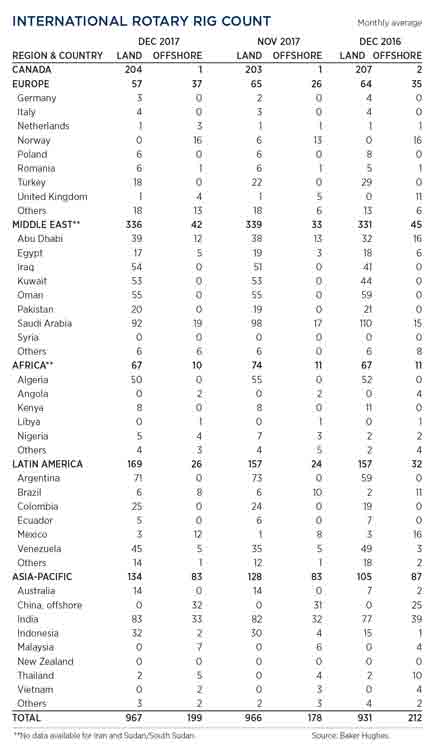
INTERNATIONAL ROTARY RIG TABLE
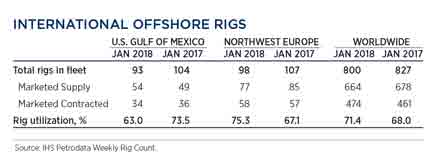
INTERNATIONAL OFFSHORE RIGS TABLE

- Management issues- Dallas Fed: Activity sees modest growth; outlook improves, but cost increases continue (October 2023)
- Industry at a glance (June 2023)
- Industry at a glance (May 2023)
- Management issues- Dallas Fed: Oil and gas expansion stalls amid surging costs and worsening outlooks (May 2023)
- Executive viewpoint (April 2023)
- Global offshore market is on the upswing (April 2023)

