Industrial platform harnesses Big Data to reduce cost, increase efficiency and safety
The fluctuating cost environment of drilling operations, combined with external pressures to decrease risk, is driving a shift in how the oil and gas industry approaches innovation. While developing more advanced equipment has, historically, been the main catalyst for transformation in the industry, this strategy is now insufficient to address the modern era’s changing economic and technological landscape. The rise of Big Data, however, is poised to change the oil field in ways never thought possible.
Recognizing this shift, National Oilwell Varco (NOV) has developed Max, an industrial data platform that enables the large-scale collection, aggregation, and analytics of real-time equipment data to improve performance while decreasing maintenance costs across many products and systems.
BIG DATA
Big Data, as a concept, asserts that there is exponentially more data being collected at a faster rate than ever before, but the concept is about more than just the volume of data. It is about providing a complete picture of the data’s value, and of the actionable feedback on a process or piece of equipment that is monitored. Traditional data storage and analytics tools, particularly in the oil and gas industry, aren’t designed to process today’s huge amount of data, or handle the speed with which it is being collected.
The growing industrial internet of things (IIoT) landscape, and the emergence of open-source data-handling tools, has accelerated the use of Big Data across all industries, giving rise to new technologies and strategies that can address new challenges. Still, an information management strategy behind Big Data must be able to integrate traditional data with new types of data, primarily digital, in a holistic way.
In the late 1990s, control systems were added to capital rig equipment to automate common drilling activities. In 2001, the first completely integrated drilling rig package was delivered from a single supplier. The promise in implementing such a package was that software would continue to be developed and used to integrate the rig’s systems, such as mud, well control, and drilling process. As instrumentation became more readily available, data logging soon followed, allowing operators and contractors to keep a detailed record of the activities performed and track the accuracy of controls.
Due to the high demand for such data, operators and contractors started streaming data off the rig and into the office for monitoring and analysis. The evolution continued with the rise of descriptive analytics, which is the practice of reading data and determining what happened. Descriptive analytics provide a foundation for predictive analytics (Fig. 1) which, based on the data, inform the operator on what will happen in the future.
The challenges that the concept of Big Data introduces to the oil and gas industry are unlike the challenges that it poses to other industries. Data access and transmission are limited severely by the minimal bandwidth available on offshore rigs, and in remote locations on land. Additionally, the quality of the raw data varies greatly, due to the variety of data sources, differing data tracking protocols, and variance in parameters being monitored.
Another barrier to entry is that the oil and gas industry has, historically, been slow to adopt new technologies, making it very difficult for teams to introduce Big Data solutions within their companies. This issue is further complicated by the fact that the original equipment manufacturers (OEMs), who traditionally have pioneered equipment over digital technologies, do not always see the benefit of implementing Big Data solutions into their existing product lines.
Finally, the volatile economic climate and cyclical nature of the oil and gas industry act as both drivers and limiters of innovation: downturns present an opportunity to focus on development in new ways but also force companies to reduce expenses that do not immediately generate revenue. NOV, understanding these challenges and seeking to advance digital solutions to the next logical step, has begun to focus on data-driven service offerings, to reinvent the process.
More than 15 years of gathering data from equipment in the field has cemented a belief that integrated packages are most effective for industry clients when backed by data that informs on how operations work together holistically. The key to unlocking the true potential of these data in the oil and gas industry lies in the connection between equipment and remote support; anything on a drilling rig with a computer now connects to the internet and provides a steady stream of live operational data. The proliferation of Big Data-handling tools has enabled a massive amount of historical operational data—gathered from installed equipment around the world—to be used to create intelligent solutions for optimizing drilling operations and improving maintenance practices.
INDUSTRIAL DATA PLATFORM
NOV’s industrial data platform collects data from any source, including onshore and offshore rigs, production wells, service equipment, and manufacturing facilities. The historian element of the platform structures the data in a way that makes it human-readable and valuable, even in its raw state, while also offering visualization and notification capabilities.
Organizing these data in one place allows for fleet-wide visibility and monitoring of equipment that work in tandem. Visibility into equipment health and performance is critical to lowering costs and allows identification of failure modes and system anomalies to facilitate long-term optimization. The data platform allows patterns and behavior to be viewed across an entire enterprise, enabling swift comparison of uptime, efficiency, and costs of assets, and identification of micro- and macro-performance indicators that control business. Data management that focuses on single assets cannot provide such a comprehensive overview.
There are many applications for this data management platform and the solutions that it offers. The suite of technologies allows raw data streaming, custom visualization hosting, and deployment of advanced data-analytics algorithms to enable notifications and alerts. Access to real-time data from equipment in the field can provide visibility into problems and enable remote troubleshooting. Condition monitoring is transformed by Big Data from simple cycle-count monitoring into a real-time analytical tool. Decades of historical data can be reviewed because of the platform’s data-querying capabilities. Engineering computational analysis can be applied to real-time data streams, to identify meaningful patterns and enable intelligent decision-making on the state of equipment.
The data platform is just one component of the OEM’s broader condition-based predictive analytics framework; the platform gathers detailed equipment data, deploys analytical models, and ultimately, informs the owners about equipment health. The analytics framework has three other components that work with the data platform to enable integrated solutions:
- The machine engineer, who serves as a subject-matter expert, can conclusively prove system health. Having a dedicated engineering staff, which understands the data, ensures that design and manufacturing align with the results from the data. Additionally, a robust aftermarket infrastructure allows execution of actionable information, with experienced technicians providing continual feedback to the machine engineers, to improve on product design.
- The data scientist, who collects and compiles large amounts of data for analysis, can create systems to generate automated, actionable information. The data scientist transforms what might otherwise have been unused data, making it applicable to the particular project and ensuring its relevance.
- A large footprint of products deployed in the field. This enhances the amount of historical data, which are needed for the development of analytics, as well as the deployment potential for data-driven products.
USE CASES
Implementation of the industrial data platform and the analytics framework already has begun in both real-life use cases and proof-of-concept (POC) engineering projects. What follows are several examples.
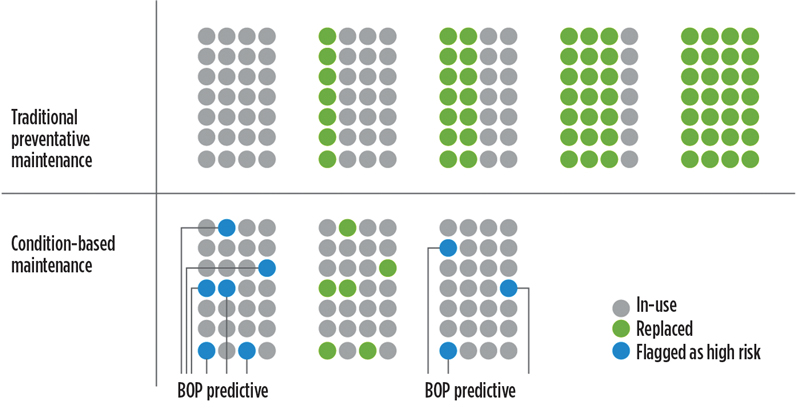
Predicting operational failure in subsea BOP systems. Unplanned rig downtime is one of the industry’s costliest problems, especially when the source of the problem is a blowout preventer (BOP). A BOP is arguably the most valuable piece of equipment to operators, due to its criticality for safe drilling operations, but a capital-intensive maintenance cycle often yields additional rig downtime. Typical condition-monitoring services, though available, are usually reactive rather than proactive, only providing identification of an issue after operations have already been compromised. The main problem, then, is that issues need to be identified, with enough time to implement a mitigation strategy, to decrease or prevent unplanned downtime.
High-pressure supply regulators are one of the most common, significant failure modes and are frequently the culprit for BOP failures. Such regulators are in continuous use during drilling operations, and the sensors that monitor them are positioned in a place where they can provide insight into an entire system’s health. Though the size of available data, and lack of data structure, are hurdles, the industrial data platform was able to analyze 14 years of structured and unstructured data with a total of six billion data points.
The platform was leveraged by data scientists, who used digital signal processing, pattern recognition, machine learning, and system regulation to diagnose failures in the BOP hydraulic control equipment. This resulted in creation of an algorithm that classifies equipment into risk levels, based on behavior. The algorithm, when deployed within condition-monitoring services, allows visibility into which components are at risk, reducing the need for unnecessary part replacement and unexpected failure of newly installed components.
The ability to predict impending failure, up to 14 days in advance, and to identify the exact source of issues, significantly decreases chances for unplanned downtime and reduces the overall cost of equipment ownership. Having access to such comprehensive knowledge on equipment health allows rig personnel to make more-informed decisions about maintenance and operations, thereby optimizing performance in both the short term and long term.
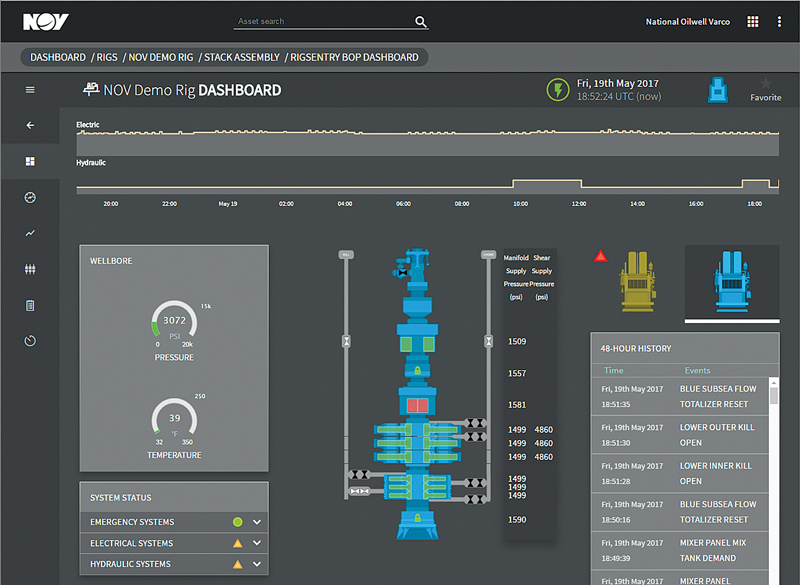
As the BOP provides front-line protection against environmental and safety hazards associated with well-control events, having a predictive service to improve reliability maximizes availability and incident avoidance, Fig. 2. At-risk components can be diagnosed and addressed during planned downtime, and operators can avoid pulling the stack unnecessarily.
Predicting failure in drilling systems. Drilling systems include the majority of topside equipment that drives the drilling process: top drives, crown blocks, drawworks, mud pumps, and so on. Any dysfunction in such drilling equipment can lead to an abrupt and expensive period of downtime. Thus, a large historical dataset covering 22 top drives was used to develop a predictive analytics framework that can predict motor overheating, due to cooling system dysfunction.
Historically, equipment operators would use rule-based alarming schemes to detect dysfunctions. In the case of the top drive, it is detrimental to the life of the insulation in the motors, if the temperature crosses a certain threshold. Furthermore, the equipment needs a certain amount of load for it to overheat and cross the threshold. This means that the cooling dysfunction could potentially stay invisible to the operator for weeks, and when it is discovered, it could be too late to effectively deal with the problem.
The predictive analytics framework takes advantage of peer-to-peer comparison between the two motors on the top drive, as well as all the other top drive motors in the fleet, to catch the slightest change in thermal behavior, which can indicate cooling dysfunction. This allows the operator to tailor a mitigation strategy that could include running to failure. Then, leveraging an auxiliary top drive, the operator can stop operations for a low-cost repair, avoiding more costly reactive repairs, or running at a lower capacity, to reduce the degradation on the equipment. This concept of mitigation aims to avoid any drilling downtime while maintaining acceptable operational efficiency, backed by the belief that the repair cost on the equipment is negligible, compared to the cost of downtime during the drilling process.
This motor-cooling framework is being validated for use in other rotating equipment on the drilling rig that has two or more motors. Additionally, the OEM is continuing its development of predictive frameworks, which include both oil-debris sensors and vibration sensors—aiming toward a prominent prediction horizon for operational data.
Coiled tubing/completion workover activities. The industrial data platform was used initially by NOV to enable large-scale remote access to monitored parameters for coiled tubing, pumping, acidizing, or hydraulic workover operations. Collecting operational data on the coiled tubing units was not a new offering, but there were limitations, which included insufficient data storage, display options, and accessibility, to previous software. Implementation of the new data platform expanded the group’s data architecture, making data accessible off-site and enabling a web-based viewer for the data.
After development began, the OEM’s was approached by an independent operator, which was seeking insight into how its coiled tubing service contractors were completing high-risk wells. Based on this need, a POC project was initiated with the operator to develop a new solution for remote data monitoring. This enabled the operator to receive data directly for real-time monitoring of coiled tubing units and remote access to data. The project scope included making the data accessible to the operator, so that wells could be monitored using existing workflows. Both NOV and the operator used the same data historian software, which allowed implementation of a seamless solution for sharing data. Once the data were published to the cloud, the operator was able to subscribe and view the data in real time.
Access to these data has been critical to improving completion operations, allowing the operator’s subject-matter experts to notice and respond quickly to signs of catastrophic events before they happen. In completion projects, such events can derail planned operating budgets. Loss prevention was thus highlighted as a major area of interest for NOV, the operator, and the contractor, with the three parties partnering to integrate monitoring across the rig fleet.
The next project phase will involve building a custom application for both operators and equipment owners, which could further enhance flexibility in the field and provide more insight into the data.
Monitoring subsea flexible pipes. Subsea flexible pipes are large and multi-layered. Such pipes play a key role in transporting the oil and gas production from a subsea well to a surface vessel for processing and storage. They also ensure environmental safety while shielding production from subsea temperatures, maintaining output efficiency and flow assurance. The traditional way of inspecting flexible pipes is an annual, remotely operated vehicle (ROV) inspection, which can take days, without having any direct insight to the intra-layer condition of the pipe.
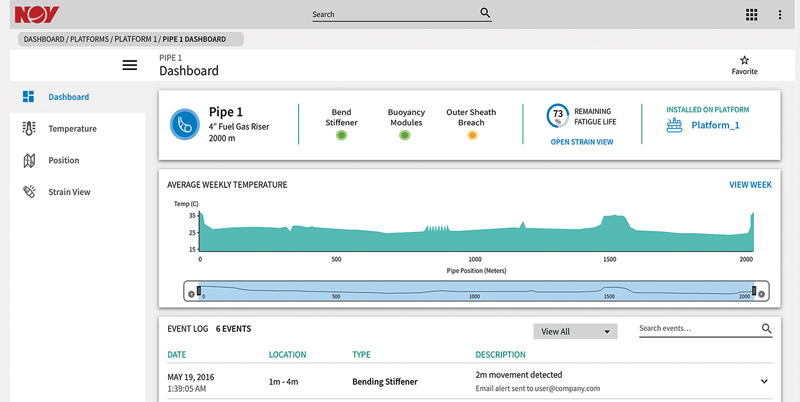
Current monitoring technology embeds fiber-optics into the construction of the pipe, to allow direct sensing of temperature and strain throughout the asset, which provides insight into its condition. More informed knowledge of pipe condition defers the need for an ROV inspection service to once every three years and beyond, instead of annually, leading to better asset integrity and reducing the cost of recurrent inspection services. Predictive analytics leverage the data from the fiber-optics system, to predict movement in the buoyancy modules that are attached to the pipe; detect and isolate water breach into the outer layers; detect any disturbance in the trenching areas; and monitor the accumulation of fatigue damage on the pipe’s most critical areas. Furthermore, it allows the operator to have direct insight into risks of dysfunctions, such as production plugs and excessive pipe pinching, Fig. 3.
Usage-based maintenance for mud pumps. While Big Data technologies assist data scientists in developing advanced predictive analytics, the data platform tools also provide automation and improvements to basic monitoring services. Using just the visualization and notifications tools of the platform, equipment owners can implement a usage-based maintenance program to cut costs on everyday maintenance practices. Previous solutions were limited in their applicability, and a manual system of recording maintenance was inefficient and inaccurate.
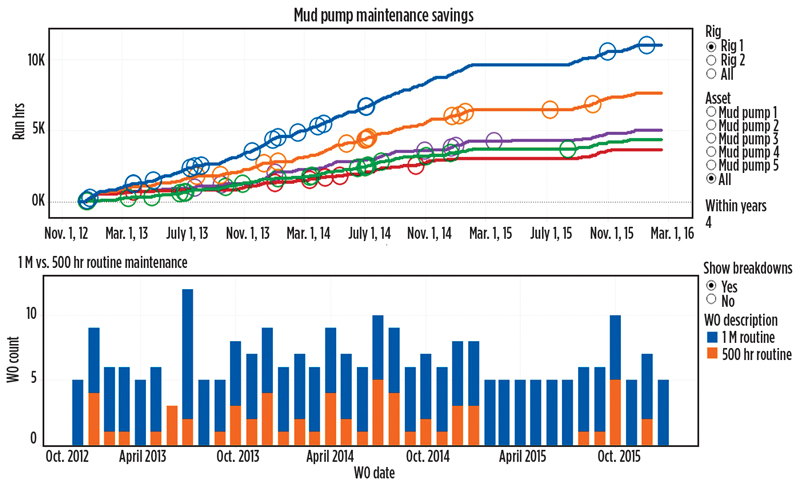
In a POC project, NOV examined maintenance practices for mud pumps, setting several objectives for the data solution: simple, fast implementation; historical data visualizations; usage-based maintenance; automated notifications; and the feasibility to expand the data platform’s functionality with more advanced calculations in the future. A calendar-based maintenance practice for mud pumps that was performed every 30 days was used as the benchmark in the POC scenario,
Fig. 4. By altering this to a usage-based parameter and only performing the maintenance every 500 run hours, maintenance costs were decreased 67% without compromising the use of the equipment.
Two events—charge pump mismatch and pump idle-time warning—were detected with the data platform. Charge pump mismatch notifications would be triggered when the charge pump was not running while the pump was operational, which leads to reduced life in valves and pistons. Pump idle-time warnings would be triggered when the mud pump sat idle for more than seven days, which causes internal components to lose lubrication.
Both of these events are also largely invisible to operators at this time. With just these two alarms, via the monitoring service, an expected event capture of almost 180 events over a three-year time period can significantly increase life and reliability of drilling equipment.
The increasing use of Big Data solutions in the oil and gas industry is driving a major shift in digital technology implementation. A growing amount and variety of information sources, bolstered by the IIoT, will provide actionable insights to transform operations and reduce capital expenditures. Big Data solutions deliver more operational clarity and visibility than previously possible, revolutionizing operator and contractor maintenance and monitoring practices. The industry must continue to embrace such innovation in the digital space to make both people and processes more efficient and more cost-effective. ![]()
- Applying ultra-deep LWD resistivity technology successfully in a SAGD operation (May 2019)
- Adoption of wireless intelligent completions advances (May 2019)
- Majors double down as takeaway crunch eases (April 2019)
- What’s new in well logging and formation evaluation (April 2019)
- Qualification of a 20,000-psi subsea BOP: A collaborative approach (February 2019)
- ConocoPhillips’ Greg Leveille sees rapid trajectory of technical advancement continuing (February 2019)

