Industry at a Glance
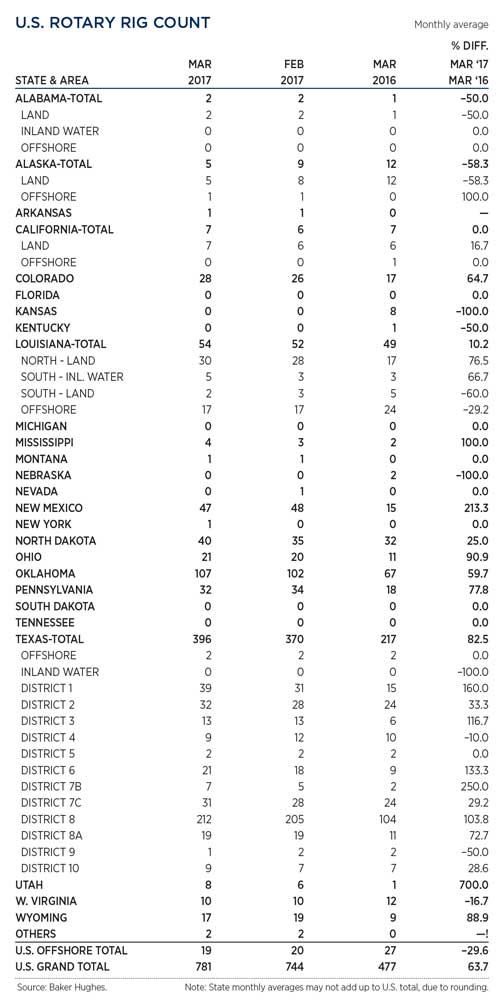
In spite of 106% compliance to pledged production cuts by OPEC countries, world crude inventories continued to build and remained above their five-year average. Low seasonal demand, and rising non-OPEC sources, limited the impact of the reductions on global supply drawdowns. In the U.S., production averaged 9.03 MMbopd swelling stockpiles to record levels, with 533 MMbbl in storage during the week ending March 17, the highest since 1982. However, benchmark crude prices remained resilient in February, trading in the $53–$55/bbl range, before falling $3/bbl during the first week of March. The average U.S. rig count increased 37 units in March, up to 781, with gains in Texas’ Eagle Ford shale and Permian basin leading the way. The international rig tally was up 4.5%, to 1,290. ![]()
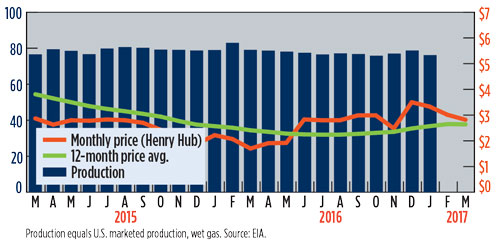
U.S. GAS PRICES ($/MCF) AND PRODUCTION (BCFD) GRAPH
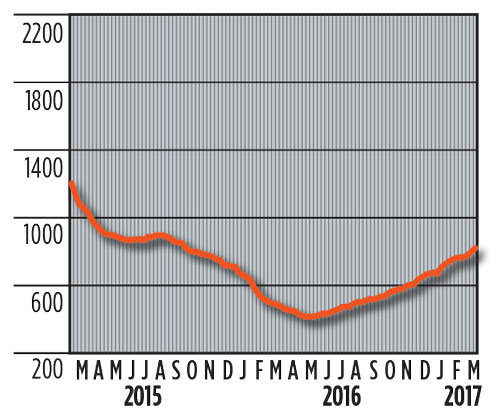
U.S. ROTARY DRILLING RIGS GRAPH
U.S. ROTARY DRILLING RIGS TABLE
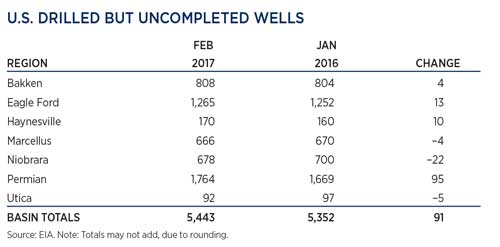
U.S. DRILLED BUT UNCOMPLETED WELLS
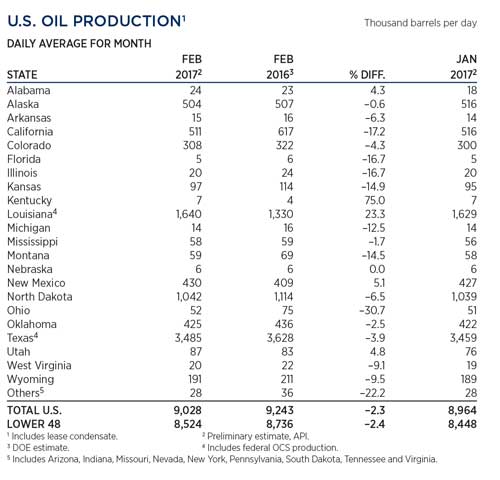
U.S. OIL PRODUCTION TABLE
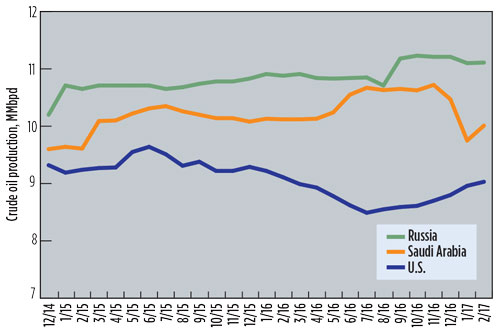
WORLD CRUDE OIL PRODUCTION, TOP THREE PRODUCERS
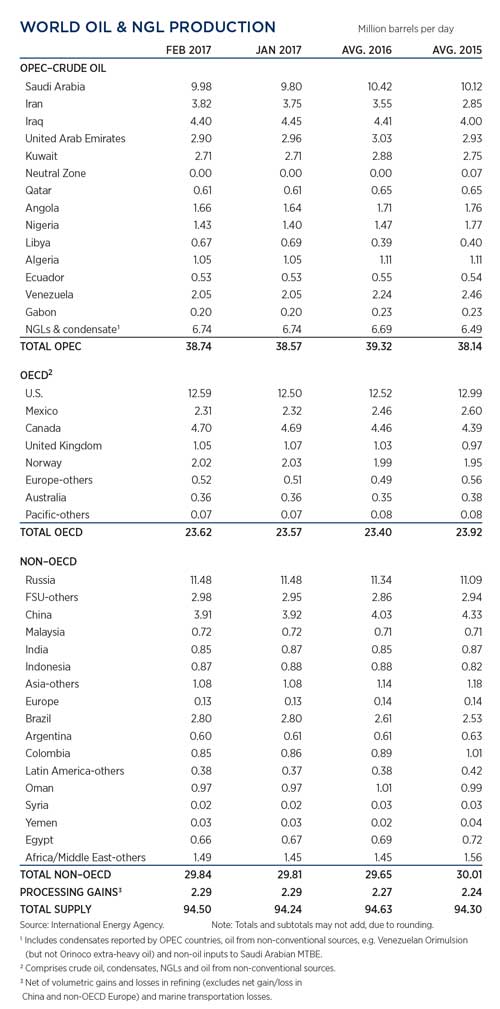
WORLD OIL PRODUCTION TABLE
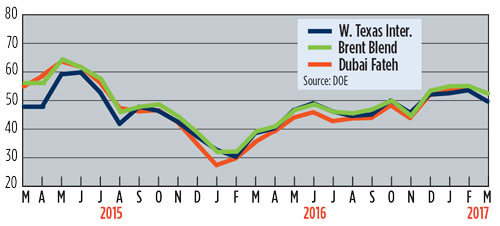
SELECTED WORLD OIL PRICES GRAPH
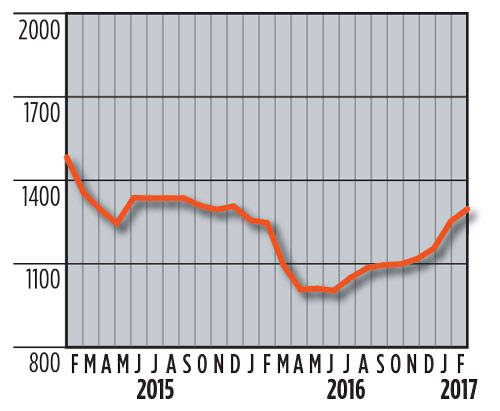
INTERNATIONAL ROTARY RIG GRAPH
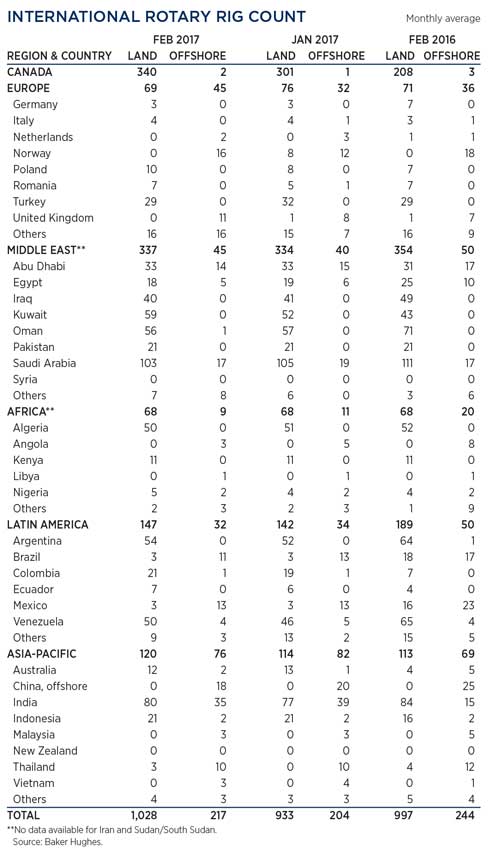
INTERNATIONAL ROTARY RIG TABLE
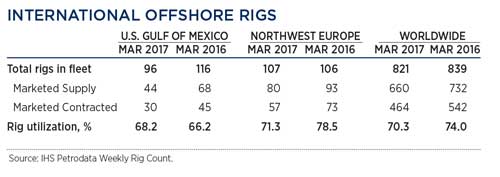
INTERNATIONAL OFFSHORE RIGS TABLE


