Geosteering in complex lithologies utilizes full formation evaluation from mudlogging data
New methodologies applied to surface logging and advanced gas data can be used in complex reservoirs to improve formation evaluation results, and also perform geosteering in specific cases.8,9,10 Water saturation, total porosity and permeability, estimated from mud logging data using the Beda and Tiwary methodology, can help improve operational and well placement decisions (optimizing operations and saving costs).1
This article explains the workflow used to achieve this and a productivity assessment of the horizontal section, which was performed using gas data.
METHODOLOGY
The methodology used in this case study can provide a preliminary quantitative, near-real-time reservoir evaluation. In this case, it was performed using advanced gas data from GC-Tracer, an advanced gas chromatograph based on TCD (thermal conductivity detector) technology, together with a semi-permeable membrane as a sampling device,2 and drilling parameters monitored by the service company.
The project involved improving production inside two reservoirs, where there is a gas cap, oil leg and water below. Since these are very thin-bedded reservoirs, the idea was to drill a horizontal well navigating through the higher permeability layers inside the oil leg, to improve productivity.
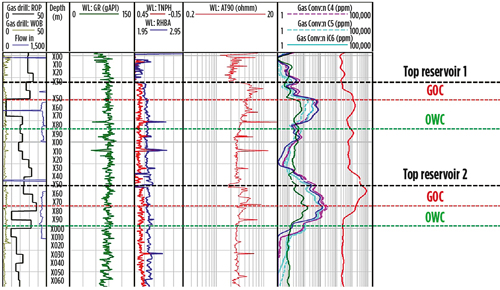
The LWD suite used for this was density-neutron-resistivity and gamma ray, but unfortunately in this type of complex reservoir, the contrast (mainly density and resistivity) between high- and low-permeability layers is very small. As a reference, the resistivities for different fluids in the reservoir measured with WL were Gas≈6-5 ohm.m, Oil≈5-4.5 ohm.m and Water≈3-2 ohm.m, as can be seen in Fig. 1. GOCs and OWCs were defined, using formation pressure data in the pilot well.
The methodology can be divided into several steps, as follows.
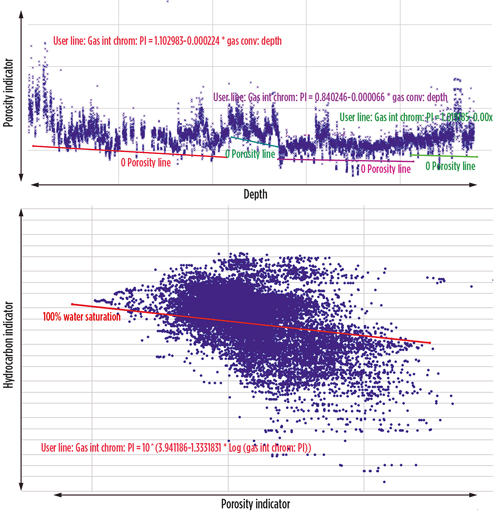
Beda and Tiwary Sw, PhiT and K calculations. Sw (water saturation) is estimated, using a principle similar to how Sw from resistivity data is calculated, using the Picket plot.1 Normalized C1 is used as the HC indicator (replacing Rt from the Picket plot), and Perforability Index (PI) is used instead of Porosity. With these two parameters, the B&T plot is generated, as shown in Fig. 2. Also, a base line representing 100% Sw (which is called Gw) is set, depending on the Background Gas (BGG), and usually is calibrated in the seal or a water-bearing interval (if it is well-recognized) inside the reservoir. The Sw will be the result of the distance from each data point to that base line. A main advantage of this procedure is the lack of dependence on water salinity, which can be really critical, especially in wildcat exploration projects.
PhiT is obtained, using the Perforability Index (PI) as a porosity proxy. PI is used as a proxy of how easy, or hard, it is to drill a unit volume of rock; therefore, this can be related to the porosity in the rock, considering that it is easier to drill through rock with higher porosity. It is calculated as the inverse of the Drilling Exponent (Dx). Also one or several base lines are set (depending on if there is a bit type change, significant lithological change, etc.) by the interpreter to define 0 porosity, Fig. 2. Combining these two methodologies, a permeability assessment can be performed.
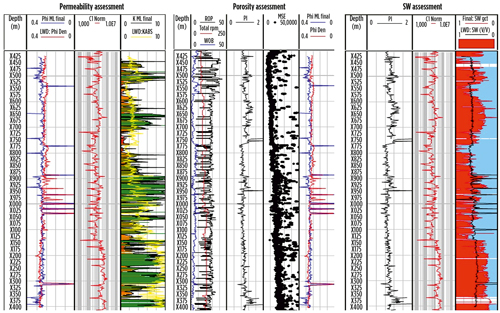
In Fig. 3, results of the B&T methodology against e-log interpretation are compared. For permeability and Sw, the desired contrast, which cannot be derived using e-log data, is obtained using gas data, allowing well placement to focus on specific layers. Regarding porosity, the calculation, using drilling parameters and density from LWD, does not show significant difference, but it was used, since there was a good match, as a QC of LWD data.
When drilling horizontal wells in the interval prior to the landing point (with high deviation, and already within the oil leg), a comparison between Advanced Gas and LWD data was performed and also integrated with the geological model, combining seismic interpretation and NMR data from the pilot well. In this way, we calibrated MLgas response to the previously created permeability model. Using this, combined with the analysis of two offset wells, we were able to generate a Theoretical MudGas Model by which we could associate the MLgas composition (C1-C7) to a qualitative indication of permeability using gas ratios, which was combined later with the Beda and Tiwary methodology.6,7
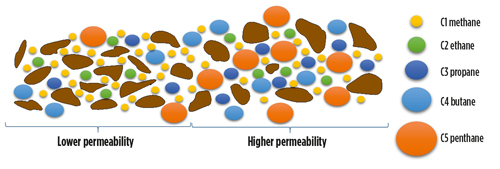
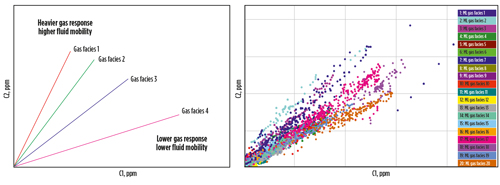
The Theoretical MudGas Model was quite simple, and based on empirical observation. As shown in Fig. 4, in tighter zones, we will find a lighter MLgas response, due to the easier movement of lighter compounds (C1 and C2 mainly) through tighter intervals; and in the more permeable ones, we will find an increase of heavier compounds, similar to how a seal assessment can be performed using mud gas.3,4 By dividing the horizontal well into different gas facies intervals using gas ratios and Xplot trends as criteria, and then comparing these intervals between themselves, using ratio values, trends and slopes in Xplots, we can provide a qualitative permeability ranking of these intervals in the horizontal arm, Fig. 5. We then classify each facies with the same categories, as in the previous step.
Data integration/final assessment. After performing the previous steps, we obtained different permeability/fluid mobility indicators, which can be integrated to perform a final assessment of the drilled reservoir interval quality. This procedure was performed continuously at the well site while drilling, and provided periodic updates at every pipe connection, when requested, or when significant changes were noticed, to use these data and interpretation for more effective geosteering.
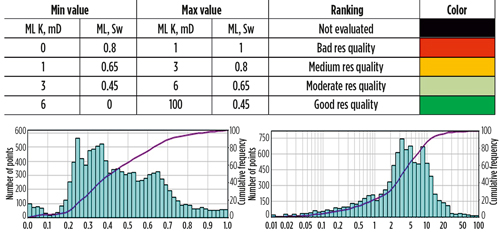
To avoid a very complex integration of the different results, several thresholds were defined for each parameter using histograms, and they were classified into categories: Bad, Medium, Moderate and Good reservoir quality, as shown in Fig. 6.
CASE STUDY
First, a good follow-up and QC of the gas data is of great importance to obtain confident results.5 This is one of the most important steps of the workflow, since your data are as valid as your confidence in their reliability, and this could guarantee it. After applying these different steps, the resultant classification of the horizontal arm, apart from being able to perform near-real time recommendations for well placement (this interpretation showed, at each connection, that the formation’s permeability was decreasing, and together with the geological model, the trajectory could be adjusted), could also provide a final qualitative interpretation of the best productive intervals of the horizontal section.
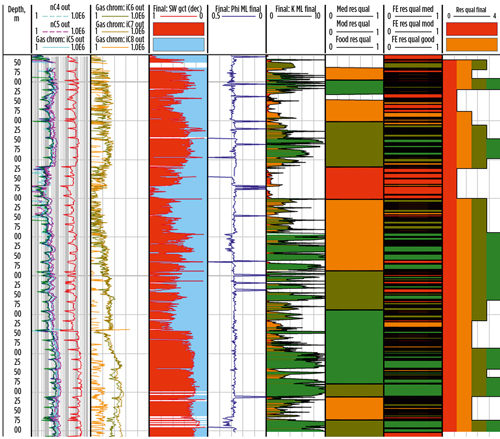
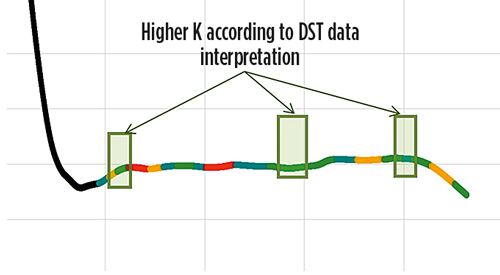
In Fig. 7a, one can see how the integration of the ranking by Sw, PhiT and K on one side, and the MLgas facies on the other, is performed, and the final resultant zonation. Also, the resultant well interval productivity ranking can be seen in Fig. 7b against the best producing intervals from the DST data, and the reservoir engineering department’s interpretation.
Even though this methodology was applied in horizontal wells, it also can be very useful in conventional wells. This, translated into operational decisions (optimization and cost-saving), can result in completion, well testing optimization, a well logging program and fluid sampling optimization that can have significant money-saving.
From this interpretation, a suggestion was made to reduce the LWD suite by removing the Den/Neu, since it operates using a radioactive source downhole. This way, the cost will be reduced (just to use a near-bit GR and resistivity, which are not expensive tools) and also, it will reduce the risk of getting stuck with a radioactive source downhole.
CONCLUSIONS
The methodology to perform an alternative to the typical e-log formation evaluation has been proven to be a solid, valid approach. In our complex reservoir, it has provided significant information from the interpretation of mudlogging gas and drilling parameters, which is in direct correlation with e-log (but still with higher contrast in K and Sw calculations, allowing us to perform an accurate well placement), and DST-interpreted data, confirming this approach is reliable. A good follow-up and QC of the gas data is very important, and it will provide confidence in the interpretation.
It is important to keep in mind, for future formation evaluation challenges, that this methodology has been applied on a horizontal well, but it can be applied to any well. Also, it is an attractive approach, especially in reservoirs with very low water salinity (very low or no resistivity contrast), unknown water salinity, low resistivity/density contrast reservoirs, etc. Also, considering the lower cost of this equipment against WL/LWD hi-tech suites, these methodologies are significant for appraisal and development phases, where the MLgas response can be calibrated against the exploratory wells, reducing formation evaluation costs. ![]()
ACKNOWLEDGEMENTS
We would like to thank everyone involved in the successful application of this workflow, including our management, especially Roberto Varadé, for his confidence in these new methodologies, and the opportunity to try and apply them. We also thank Giulio Beda for his continuous input and support of these new methodologies and applications. Also, we would like to thank Gbenga Yemidale and Giovanni Pinna (Weatherford SLS) for their follow-up, support and input in this project.
REFERENCES
1. Beda, G., and D. Tiwary, D., “An innovative approach for estimating the Sw and porosity, using gas and mudlogging data in real time,” Repsol E&P, 2011.
2. Brumboiu, A. O., D. P. Hawker, D. A. Norquay and D. K. Wolcott, “Application of semi-permeable membrane technology in the measurement of hydrocarbon gases in drilling fluids,” SPE paper 62525, SPE/AAPG Western Regional Meeting, Long Beach, Calif., June 19-22, 2000.
3. Beda, G., R. Quagliaroli, G. Segalini, B. Barraud and A. Mitchell, “Reducing uncertainties in formation evaluation through innovative mudlogging techniques,” Elf E&P, 1999.
4. Blanc, P., F. Laran, C. Boehm, M. Capot, J. Brevière, H. Chauvin, N. Fréchin and A. Benayoun, “Reducing uncertainties in formation evaluation through innovative mudlogging techniques,” SPE paper 84383, SPE Annual Technical Conference and Exhibition, Denver, Colo., Oct. 5-8, 2003.
5. Kandel, D., G. Segalini, B. Barraud and R. Quagliaroli, R., “Improved integrated reservoir interpretation using gas while drilling (gwd) data,” SPE paper 65176, SPE European Petroleum Conference, Paris, France, Oct. 24-25, 2000.
6. Haworth, J. H., M. Sellens and A. Whittaker, “Interpretation of hydrocarbon shows using light (c1-c5) hydrocarbon gases from mud-log data,” AAPG Bulletin, Vol. 69, No. 8, August 1985.
7. Beda, G. and D. Manfroi, “Utilizzo del gas di perforazione per ottimizzare il geosteering nei pozzi orizzontali: approccio metodologico,” Eni.
8. PIxler, B. O, “Formation evaluation by analysis of hydrocarbon ratios,” SPE, Journal of Petroleum Technology, June 1969.
9. Whittaker, A. and G. Sellens G., “Advances in mudlogging, analysis use alkane ratios from chromatography,” Oil & Gas Journal, May 18, 1987, pp. 42- 49.
10. Whittaker, A., “Gas-detection technology improves reservoir interpretation,” Oil & Gas Journal, August 1991.

