Optimizing subsea multiphase boosting station and controls
Subsea multiphase boosting is a robust, effective means of improving production from new or aging reservoirs. For optimum results, the overall production system should be considered when designing individual components. This includes interaction of the multiphase pumping station with the upstream and downstream flowlines, and well and topside processes.

Presented in this article is the design of a subsea multiphase boosting system with integrated controls, covering key milestones toward system-level integration of all major processing equipment. To capture accurately the interactions between the subsea multiphase boosting station and the connected flowlines, a process simulator (K-Spice) is linked to a multiphase pipe flow simulation tool (LedaFlow), Fig. 1. This integrated solution is then linked to Matlab/Simulink software for development of control strategies.
Traditionally, process simulation modeling of rotating machinery has been limited to either compressors or pumps. For this project, Kongsberg has developed a multi-phase rotating machinery module in K-Spice, which allows for accurate performance predictions at varying gas volume fractions. The three inter-connected engineering tools allow for a realistic simulation environment, capturing complex interactions between the different processing components, the connected flowlines and controls. This foundation optimized reliability, cost and performance of the complete production system.
BACKGROUND
Multiphase boosting technology plays a key role in subsea oil and gas production. This development allows simplification and greater flexibility for subsea processing units. A boosting station includes a multi-stage pump, which tolerates a high gas amount at its inlet, thereby eliminating the requirement for separation and transit via two separate flowlines. This article focuses on a system-level integration of the different components to maximize the project’s value. This integration is conducted via both a system-level optimization of the design of the individual components, and the design of system-level control strategies.
The key components of a subsea boosting station, such as a multi-phase pump, experience strong interactions with the other components (e.g., slug-catcher placed upstream of the multiphase pump), and also with the whole production system, and the upstream and downstream flowlines. The operation of the subsea station influences the flow pattern in the connected flowlines, the pressure in the wellbore, and therefore, the production rate. These complex interactions need to be considered when designing a subsea processing station, but also during operation; therefore, impacting the control of its main components.
Given the significant impact of these interactions at both the design and operating stages of the project, they must be given full consideration from the early stages of the design process. It is usually impractical to evaluate these system-level interactions early on, because this would slow down progress significantly and increase development costs, but also because of the scale required by such experimental units. The actual system is likely to include long flowlines (many km), whose geometries have a strong impact on the system dynamics and the flow pattern in these flowlines. As a consequence, integrated modeling tools are a strong asset to capture, at a reasonable cost and accuracy, the expected dynamics of a subsea production system. These integrated models enable one to study the interaction between the subsea boosting station components, and with the flowlines, effectively serving as a virtual experiment for component and controls design.
The development of an integrated model, covering both the subsea station and the flowlines, involves capturing both the details of the key station components and their nominal and off-design performance, along with complex multiphase flow dynamics in long pipes. The intrinsic complexity of these components motivates the use of specialized tools, which are, therefore, different for the processing equipment and the flowlines. Furthermore, these tools need to be integrated and run simultaneously to capture the dynamic interactions between the system’s main domains. The solution selected for this project is the software suite developed by Kongsberg Oil & Gas Technologies, which includes the process simulator, K-Spice, and the transient, multiphase pipe flow simulator, LedaFlow.
SIMULATION TOOLS
K-Spice is a modular dynamic simulation tool that uses an object-oriented programming language. A process model is built up, using smaller modules. The flow of information between the modules is configured, using input and output variables. K-Spice is OPC-compliant, which allows it to integrate with most standard control systems and various third-party tools, such as Matlab.
The key K-Spice component is the simulation manager, which runs and coordinates the process models realized in the model servers. The program acts as a database management system, providing an interface between the models and user interface. The simulation manager also handles communication between the model and external items, such as control systems and third-party simulators.
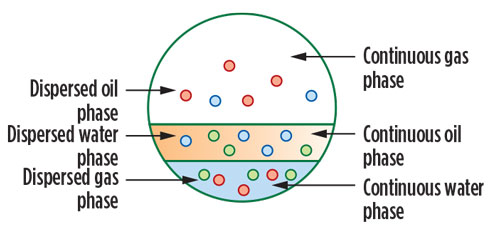
LedaFlow is a transient, multiphase flow simulator. The model employs a three-fluid, nine-field modeling concept to simulate the thermo- and hydrodynamics of the gas-oil-water three-phase flow in pipeline systems, Fig. 2. In this approach, the various phases are assumed to flow in continuous zones and in the form of dispersed droplets within another zone. For instance, oil is transported in the form of continuous oil, oil droplets in the water zone, and oil droplets in the gas zone. In a three-phase situation, the flow generally consists of three zones and nine fields. The momentum and energy conservation equations are solved for each of the three zones, while the mass equation is solved for all nine fields, yielding 15 conservation equations altogether. LedaFlow offers an advanced multiphase modeling basis, as well as special advantages in areas, such as capturing of hydrodynamic slugs and temperature calculations in pipelines using a buried-pipe model.
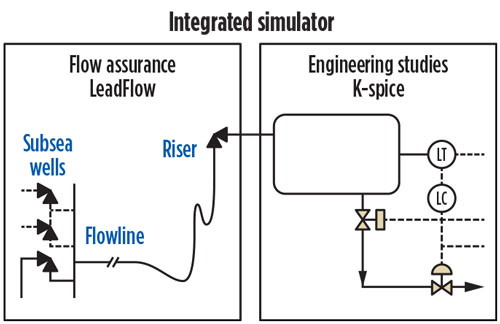
LedaFlow/K-Spice link. By linking LedaFlow to K-Spice (Fig. 3), we can make simulation models that cover the whole production facility from the reservoir, via subsea process unit, to the topside plant, with an offloading system or export pipelines.
MODELING AND SIMULATION
Subsea boosting station. The subsea station considered would typically be installed on a setup, which involves two flowlines running in parallel from the well to the surface. These two flowlines feed into a single, subsea boosting station. The boosting station increases the pressure of the production stream, and distributes the high-pressure stream back to the two flowlines. Assuming symmetry in the system (supposing the two flowlines have a similar flow and general properties), the analysis has been simplified to only consider one of these flowlines. To maintain the right scale for the subsea station, the size of the components is reduced accordingly, and duplicate elements are simplified into a single component.
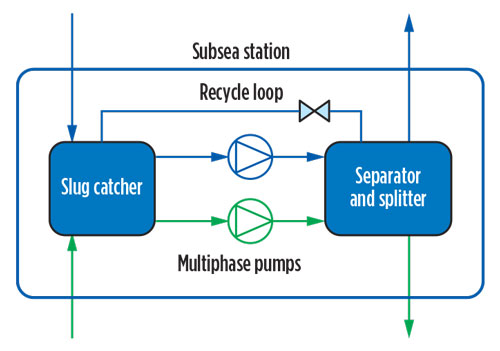
Figure 4 shows the high-level layout of the subsea boosting station considered. Elements in blue are considered, while elements in green, corresponding to the full two-flowline configuration, are neglected. The direct implication is that while the original setup comprises two pumps in parallel, the considered setup includes only one full-scale pump for one flowline. The size of other system elements, including the piping, slug-catcher and splitting device, is divided by two to keep the right scale.
Multiphase pump. A new product under development at GE, the pump increases the pressure of a multiphase hydrocarbon stream. This allows increasing production and recovery on an existing field or enabling an economic development of new fields with long step-outs. This component can be seen as central to the subsea boosting station, along with auxiliary components designed to allow safe, efficient operation of the pump.
The following key characteristics of the multiphase pump need to be captured, in order to size these auxiliary components and design the control strategies:
- Performance maps: efficiency and head delivered by the pump, depending on the volume flow, the speed, and the gas volume fraction (GVF) at the inlet of the pump.
- Minimum and maximum allowable flow in the pump, depending on the pump speed and the GVF.
- Minimum and maximum allowable speed for a given GVF. It is important to limit the pump speed to an acceptable range, depending on the GVF, to avoid excessive pressure increase at lower gas fractions.
- Pump inertia and motor characteristics, in order to accurately capture the dynamic response of the pump.
Slug-catcher. The subsea station components are designed to ensure both short-term and long-term safe operation of the pump. In the event of a strong GVF variation at the inlet of the pumping station (which could be almost instantaneous in the case of a gas bubble entering the system), it is important to limit both the rate of change and possibly the absolute value of the GVF at the inlet of the pump. This short-term protection function is fulfilled by the slug-catcher, which essentially serves as a buffer at the inlet of the pumping station, to protect against these strong gas fraction variations. The slug-catcher also serves as a flow pre-conditioning unit to feed the pump with a high quality homogeneous flow.
The buffer function of the slug-catcher is achieved via a tank, which contains a given inventory of gas and liquids during normal operation. The tank is self-regulating in the sense that the GVF of its outlet will depend on the relative amount of gas and liquid in the tank. If a large pocket of gas enters the system, the liquid level in the tank will slowly decrease, and so will the GVF at the outlet. This self-regulating buffering function can be achieved by a set of perforations in the tank at various elevations, which are all connected to a single outlet of the device (7). Therefore, any change in the liquid level in the tank leads to a change in the amount of perforations delivering gas and liquid, and therefore impacts the overall GVF at the device outlet.
Two solutions were used to model the slug-catcher in K-Spice:
- A separator model, with a modified nozzle GVF function, which depends on the nozzle elevation. The base model would normally calculate a liquid-dominated outflow, if the liquid level is above the nozzle height (and vice versa). The proposed modification would allow the user to modify the way this discharge GVF is calculated, to represent the device behavior with a single nozzle.
- A closer representation of the slug-catcher design, using a separator model with a large number of outlets spread along the height of the unit, and merging these outlets’ nozzles into a single-outlet pipe element. This option has the advantage of offering a more “predictive” modeling approach, but it is more complex to implement.
- Homogenization of the flow at the outlet of the slug-catcher is not modeled at this point, because the pump performance is described using maps that depend only on the overall GVF, and do not account, for example, for the bubble size distribution or flow regime at the pump inlet.
Separator and recycling loop. While the previous slug-catcher serves as a short-term protection against inlet slugs for the pumping station, a very long gas bubble could, potentially, fully deplete the slugcatcher liquid inventory and, therefore, render this component incapable of protecting the pump against excessive gas fraction at the inlet. A long-term protection mechanism is provided, using a combination of a separator with a recycle loop.
Recycle loop functioning is straight-forward: by recirculating a fraction of the pump discharge back to the inlet, the pump can maintain an acceptable GVF at its inlet during an extended period of inlet gas slugs. This mechanism’s efficiency is increased further by using a separating device at the pump outlet, decreasing the gas fraction of the flow being recirculated. Separation at the pump outlet can be of rather low efficiency: an optimization process determines the most cost-efficient separator design that meets the separation efficiency requirement. Given the relaxed constraints in terms of separation efficiency, a standard separator (e.g., vertical vessel) may not be required. It could be replaced by a more compact, simple solution, such as a pipe split allowing recirculation of a larger amount of liquid to the recirculating branch.
System flowlines. To accurately model interaction of the subsea station with the overall oil and gas production system, the upstream and downstream flowlines have been modeled, using the transient multiphase pipe simulator, LedaFlow. The geometry of both flowlines corresponds to a realistic field in the North Sea.
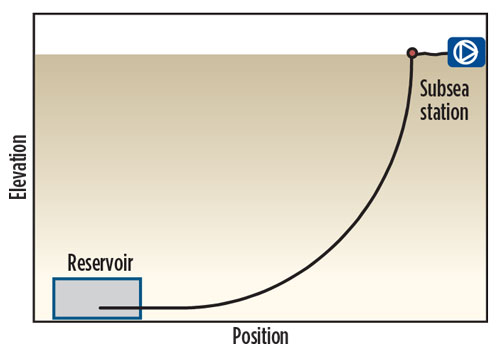
The upstream flowline consists of the well and its production area, the wellhead, and the pipe to the inlet of the boosting station. Figure 5 shows the elevation profile of the well area and the flowline to the pumping station. The well consists of a long, horizontal section (several km). The wellhead is shown as a red dot on the surface. The inlet of the subsea boosting station is connected to this flowline at the rightmost position in this chart. The upstream section is modeled in a single LedaFlow model. The wellhead is modeled, using a valve where the valve position is set using a conductance table. The well section of the model has a temperature boundary condition, with an imposed temperature gradient based on the region ground properties.
The model uses a pressure boundary condition to describe the inflow: pressure in the reservoir is assumed constant during the simulation at a fixed value. The reservoir productivity index (linear PI) is also fixed during the simulation, meaning that variations in the well pressure will result in variation in the production flowrate. It is important to represent the impact of the pump operation on the production rate, a key measure of a successful system design and control strategy. Using PVT table input, LedaFlow performs a flash operation in the reservoir to estimate the phase distribution flowing in the well. The reservoir communicates with the well over a spatially extended production area, i.e., the PI is given per unit of length. This allows capture of the changing inflow over the length of the production area, which depends on the pressure drop in the horizontal section of the well.
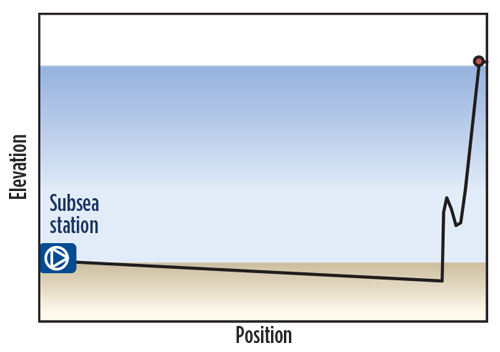
In LedaFlow, the downstream section of the flowline is modeled as a single, long (several-km) pipe element that is a negatively inclined, almost horizontal section followed by an S-shaped riser. The flowline geometry corresponds to the same field where the well data were taken from, ensuring consistency in the boundary conditions. Figure 6 shows the downstream flowline’s elevation profile.
The S-shaped riser is likely to be prone to slug generation, if the flowrate drops below a minimum value, which allows testing the response of the subsea boosting station to severe slugging (and therefore pressure oscillations) at the discharge of the station. The LedaFlow model includes a topside choke valve (shown in red in Fig. 6). A constant pressure boundary condition is imposed after this topside choke, therefore assuming the topside separator pressure can be controlled perfectly.
MODEL INTEGRATION
The subsea boosting station model in K-Spice, and the upstream and downstream flowline models in LedaFlow, are integrated for simultaneous simulation. A link is established in K-Spice, at both boundaries of the subsea stations, to the corresponding LedaFlow models. As a result, data for the pressure and flowrate are exchanged between the two tools, and operation of the subsea station influences the flow regime and properties in the flowlines, which impacts the station boundaries. The whole model is run from K-Spice, and all data (including flowline-related data) can be accessed in the tool. The design and validation of control strategies are enabled by an OPC link between K-Spice and Simulink, using an OPC server. The three interconnected applications allow for full, faster-than-real-time, co-simulation of the subsea production system and its system-level controls.
DYNAMIC SIMULATION
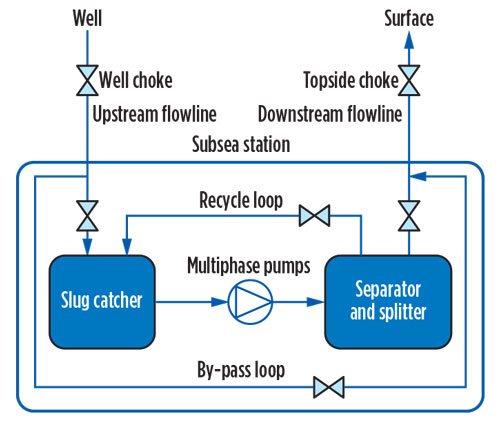
Simulation results are presented graphically for the pump pressure, speed and GVF. Graphs for the phase-mass flowrates in the downstream pipeline are also given. System safety is the most important consideration for the start-up simulation, to define operational steps. That means the multiphase pump ramping up to the desired operational point without exceeding safety limits for pressure and temperature. Also, the pump must be kept within the pump-map boundaries during start-up. Figure 7 is a schematic of the subsea boosting station, including the path of the bypass loop and station inlet valve (upstream of slug-catcher) and outlet station valve (downstream of separator).
Before initiating start-up of the subsea boosting station, all pipelines are filled with stagnant conservation liquid, and all valves are closed. The procedure for starting up the multiphase pump, and bringing it to the operational flow condition, consists of five sequential steps:
- The subsea boosting station outlet valve, recycle valve and by-pass valve are opened to equalize pressure from the flowline.
- The well choke and the station inlet valve are opened, and natural production occurs through the bypass line.
- The subsea boosting station’s outlet valve is closed, followed by a ramp-up of the pump to its minimum operating speed. The pump is now recirculating fluid through the recycle loop.
- The subsea boosting station’s outlet valve is re-opened, while the bypass valve and recycle valve are closed. Production occurs from the well, through the subsea boosting station, to the surface.
- The pump is ramped up to operational flow condition.
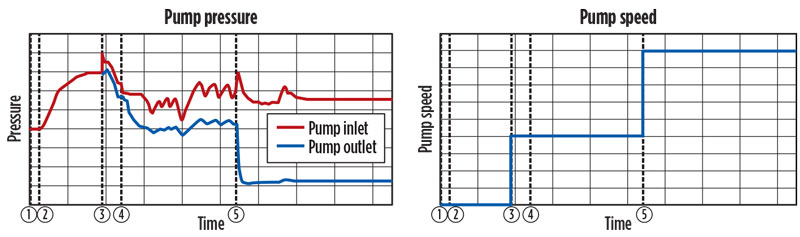
Figure 8 shows the pump pressure and speed during the start-up simulation as a function of time. The pressure across the pump is equal (steps 1 and 2) until the pump is ramped up to its minimum operating speed (step 3). The well choke is opened during step 2, increasing the pressure in the station. As the outlet valve of the subsea station is closed, and the pump starts recirculating (step 3), there is an increase of pressure across the pump, as the flow is energized. During ramp-up to minimum operating speed, the pump first generates higher head, because the pump is liquid-filled, and later, the head reduces, due to an increase in GVF. When the outlet valve of the subsea boosting station is reopened (step 4), production occurs through the pump, and the pressure drops.
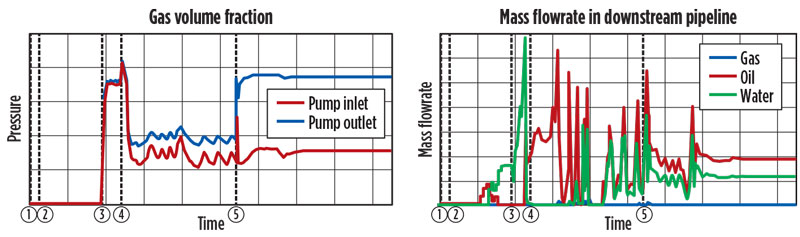
Figure 9 shows the GVF in the pump, and the mass flowrate for in the downstream pipeline for gas, oil and water during start-up simulations as a function of time (steps 1-5). When the pump is producing at the minimum operating speed (between step 4 and 5), oscillations can be observed in the pump pressure and GVF, as well as in the downstream pipeline flow. These oscillations are caused by severe slugging in the downstream pipeline predicted by LedaFlow, because the flowrate is low with regard to the selected flowline diameter. However, when the pump is ramped up to nominal operating speed (step 5), the flowrate is increased, and the slugging behavior disappears, resulting in a safe and steady operating condition.
CONTROLS DESIGN
The integrated co-simulation environment enables the design and validation of different control strategies in real time against a high-fidelity simulation model for the entire subsea production system, from reservoir to topside choke. The environment also enables trade-off studies between equipment, controls, instrumentation, actuation and the system topology.
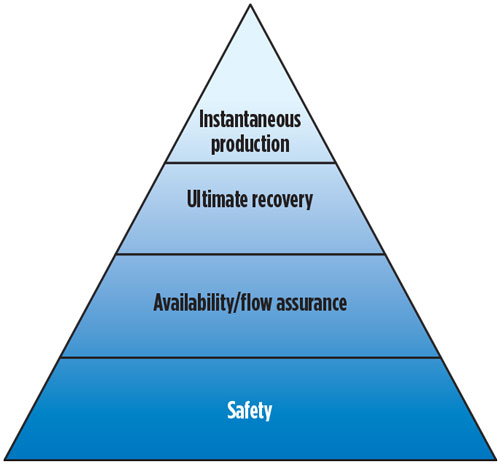
When evaluating control strategies for the multiphase boosting station, multiple objectives need to be considered. Figure 10 illustrates a hierarchical view of the most important categories of control objectives. At the bottom of the pyramid is safety, which is obviously the highest priority.
The second layer is availability. This includes the mitigation of various flow-assurance risks, such as hydrate or wax formation, scaling, or severe slugging. Availability further encompasses the ability to identify and isolate certain failure modes, such as sensor faults, and to revert to fault-tolerant control strategies in such cases.
The third and fourth layers of the pyramid are ultimate recovery of the instantaneous production rate. Ultimate recovery is influenced by a broad range of measures and decisions taken by the operator on a long time-scale (weeks to years), while instantaneous production is determined by operational decisions and set-points on a much shorter time-scale (minutes to days). While the boosting station controller, itself, will not have an immediate impact on recovery, it is important to note that the operation of the multiphase boosting station may, in some situations, be governed by strategic decisions driven by ultimate recovery. This is the driver, rather than the desire to maximize instantaneous production rate at any given point in time.
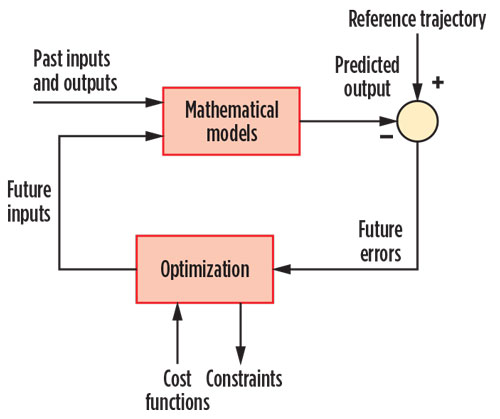
The set of control objectives and restrictions can either be formulated as a single optimization problem, used to determine the best choice of control inputs at each point in time, or it can be regarded as a set of individual control loops, for which decentralized controllers are designed. Figure 11 depicts the global approach, formalized in the model-predictive control (MPC) framework.
According to the MPC framework, the predicted future system states are compared to a trajectory of desired reference states. Choosing the optimal control action then requires solving a constrained optimization problem in which a cost function is minimized. The constraints are nonlinear equations and inequalities defining the dynamics of the system, and the operating margins of each system variable, such as static and dynamic loads, pressures and temperature limitations in certain parts of the system, GVF, and robustness of system response in case of uncertain parameters.
The outcomes of this optimization problem are the inputs to a set of actuators, which correspond to the opening of the recirculation valve, the pump speed, and the wellhead and topside valves. The corresponding control action is taken, and in the next time step the evolution of system states is measured, and a new optimization problem is solved, to obtain the next set of control actions.
Not all system states, such as consumed pump power, volume flow, pump speed and GVF, will be directly measurable. And even in cases where sensors are available, fallback strategies need to be implemented for a case of failing sensors or implausible sensor readings. In these cases, model-based estimation techniques are used to determine the unknown sensor states, based on the existing measurements. For example, the pressure at the base of the riser can be estimated using the physics-based model of the subsystem, and an observer designed to calculate the missing pressure values. 12, 13
CONCLUSION
Enabled by the integration of a process-simulation tool and a transient, multiphase pipe flow simulator, an accurate simulation of the boosting station and its flowlines within a single model allows capturing key interactions between the processing equipment, the well and the flow conditions in the pipeline and riser.
The simulation of these interactions is critical to support the design of control strategies and the evaluation of their benefits on the overall oil and gas production system. The extension of the modeling boundaries from the reservoir to the topside processing facilities offers a flexible simulation environment, which can reduce development times significantly, and facilitate the co-development of oil and gas equipment with an underlying control system. The early development of control strategies, and their implementations, allows for system-level co-optimization, possibly improving the design of the equipment to take full advantage of the control system. ![]()
REFERENCES
- Performance Test Code on Compressors and Exhausters, ASME PTC 10, 1997.
- Schjølberg, I., M. Hyllseth, G. Skofteland and H. Nordhus, “Dynamic analysis of compressor trips in the Snøhvit LNG refrigerant circuits,” Proceedings of the ASME Turbo Expo 2008: Power for Land, Sea and Air, Berlin, Germany : GT2008, June 9-13, 2008.
- Kjølaas, J., and S. T. Johansen, “Terrain slugging in a high-pressure pipeline-riser system—large-scale experiments and predictions with LedaFlow,” paper presented at the BHRG conference, Banff, Canada, 2014.
- Danielson, T. J,. K. M. Bansal, B. Djoric, D. Larrey, S. T. Johansen, A. De Leebeeck and J. Kjolaas, “Simulation of slug flow in oil and gas pipelines using a new transient simulator,”OTC paper 23353, Houston, May 2012.
- Belt, R., E. Duret, D. Larrey, B. Djoric and S. Kalali, “Comparison of commercial, multiphase flow simulators with experimental and field databases,”BHRG Cannes, 2011.
- Gülich, J. F., Centrifugal Pumps, Springer, 2010.
- Mohn, L. W., U.S. patent 5035842,United States of America, 1991.
- Matrikon, http://www.matrikon.com/drivers/opc/. [Online]
- Camacho, E. F., and C. B. Alba, Model predictive control, Springer, 2013.
- Skogestad, S., and E. Jahanshahi, “Simplified dynamical models for control of severe slugging in multiphase risers,” paper presented at the IFAC World Congress, Milano, Italy, Aug. 28 – Sept. 2, 2011.
- Di Meglio F., G. Kaasa and N. Petit, “A first principle model for multiphase slugging flow in vertical risers,” paper presented at the IEE Conference on Decision and Control and 28th Chinese Control Conference, Shanghai, 2009.
- Jahanshahi, E., “Control solutions for multiphase flow: Linear and nonlinear approaches to anti-slug control,” PhD thesis, 2013.
- Di Meglio F., G. Kaasa, N. Petit and V. Alstad, “Model-based control of slugging: Advances and challenges,” paper presented at the IFAC Workshop on Automatic Control in Offshore Oil and Gas Production, Norwegian University of Science and Technology, Trondheim, 2012.
- DeSalis, J., “Dynamic simulation of multiphase pumps,” BHR Group Conference Series Publication, Vol. 35, Bury St. Edmunds; Professional Engineering Publishing, 1998, 1999.
- Friedemann, J.D., "Dynamic subsea deepwater production system modeling: Resolving model conflicts and increasing execution speeds,”paper presented at the 13th International Conference on Multiphase Production Technology, BHR Group, 2007.
- Applying ultra-deep LWD resistivity technology successfully in a SAGD operation (May 2019)
- Adoption of wireless intelligent completions advances (May 2019)
- Majors double down as takeaway crunch eases (April 2019)
- What’s new in well logging and formation evaluation (April 2019)
- Qualification of a 20,000-psi subsea BOP: A collaborative approach (February 2019)
- ConocoPhillips’ Greg Leveille sees rapid trajectory of technical advancement continuing (February 2019)

