Using data-driven modeling to understand multi-fractured, horizontal Marcellus completions
A project was undertaken to evaluate well potential and completion effectiveness for hydraulically fractured, horizontal Marcellus completions in Susquehanna County, Pa. This article summarizes a study of the Marcellus shale’s response to hydraulic fractures and identifies performance drivers. How effective are these completions? How would these wells produce, if they were completed and fraced differently? What are the primary controllable production drivers? How significant are geology and reservoir characteristics on well production? This article attempts to answer such questions.
Identification of major performance drivers becomes important in the design and optimization of new completions. They are not just important in enhancing production response and ultimate recoverable reserves, but also prove to be important economic factors in new completion design. This study employs neural network (ANN) modeling techniques to develop a predictive model, to identify performance drivers and evaluate completion effectiveness. Sensitivities performed on the predictive ANN model, developed for this project, indicate that well-to-well variation in reservoir quality and geology has a dominant effect on Marcellus production. Issues, such as fracture spacing, frac volume, perforation distribution, proppant amount and fluid volume, also affect well production.
BACKGROUND
Just a decade ago, few geologists were excited about the potential of the Marcellus shale. However, recent successes have changed that perception, as it is now considered one of the largest shale gas plays in the U.S. The Marcellus is a middle Devonian age, sedimentary rock found in the Appalachian basin of North America, covering an area of more than 100,000 mi2 in five states. This highly organic black shale, trapped between limestone strata is found at depths of 4,000 ft to 8,500 ft, with thicknesses anywhere from 50 ft to 200 ft. and total organic carbon content of 3% to 12%.1 Experts estimate total natural gas reserves at 410 Tcf.
EVALUATION CHALLENGES
It is generally accepted that geology, reservoir, completion and hydraulic fracturing all factor into a well’s production and recovery potential. The most common method to understand what drives well production is to use hydraulic fracturing and reservoir simulation tools to model fluid flow inside the reservoir, and the hydraulic fracture, for representative reservoir conditions.
However, much information about well-specific reservoir and geomechanic characteristics is necessary to build these types of models to evaluate completion effectiveness. The information required includes permeabilities, porosity, saturations, pressures, fluid properties, rock properties, thermodynamics, etc. Such data are usually not available for reservoir modeling, so many of these are assumed, in order to forecast well production. Furthermore, reservoir models must be calibrated and updated constantly after acquiring field data (usually production, flowing pressure), to approximate reality. Also, since this is an indeterminate problem, data can be fitted multiple ways. Finding a true set of variables that produces the same results as the field data is very challenging and often impossible.
Another shortcoming to this approach is that assumptions, which are necessary to build models, can significantly affect the optimization results. The effect of assumptions in building models for hydraulically fractured horizontal wells in shale assets is even more significant, because bias is built into the resulting models. A data-driven approach, on the other hand, employs different principals, to provide much-needed unbiased perspective that traditional well modeling methods often cannot provide. In this modeling process, an effort is made to quantify and gather all available data at field and well levels. Thousands of models are constructed, based on the database, to evaluate different ways of matching the field data.
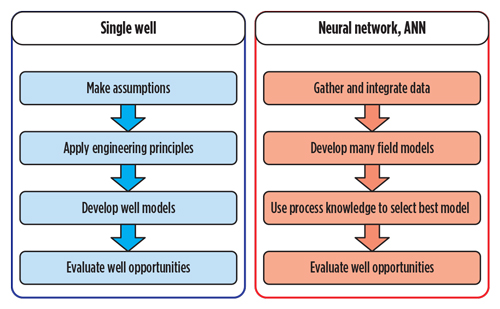
A representative model is then chosen, based on train, test and validation data error, sound engineering judgment and common sense. Understanding relationships between inputs and outputs of the model yields knowledge discovery and provides guidelines on improving the process. Unlike traditional discrete modeling, the data-driven approach, by its nature, provides a high-level perspective; it is not biased, due to assumptions made early in the modeling process. In addition an ANN model can be developed to use readily available data and/or information, which increases its utility. Schematics of the differences between the single well (discrete) and multi-well data-driven (ANN) approaches are shown in Fig. 1.
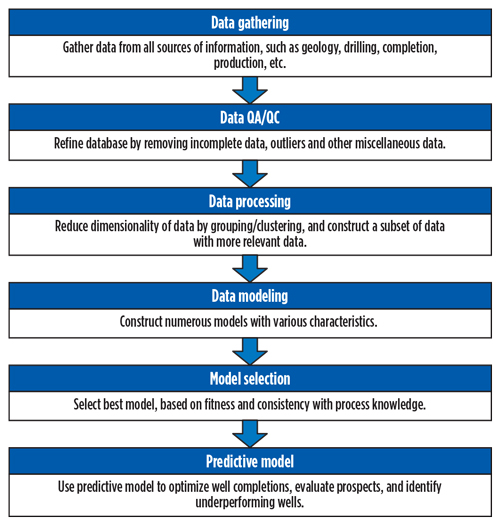
Data-driven modeling requires constructing a database of quantifiable reservoir and well-related information. Therefore, the first step is to construct such a database by gathering all types of data available for the study. Common data sources include geology, petrophysics, drilling, completion, stimulation, reservoir and production. The next step is to refine the database by eliminating erroneous, incomplete and/or outlier data. Dimensionality is the common obstacle in extracting useful information from the database, because many fields of data are available for each well; therefore, grouping different fields of data to reduce dimensionality is a common preprocessing method to process and refine the database, which may expose useful, underlying trends and correlations.
With the help of advanced modeling techniques, many models are constructed and evaluated, based on prediction error on training/test/validation datasets. A final model is selected, based on error criteria, robustness and process knowledge. This model can be used for a variety of purposes, such as optimization, prospect evaluation, underperforming wells, and evaluating completion/frac methods. This process is demonstrated in Fig. 2.
MODELING MARCELLUS COMPLETIONS
Developing any predictive well model requires information about reservoir (rock and fluid) and wellbore conditions. Traditionally, reservoir-related parameters, such as TOC, mineralogy, permeability, porosity, thickness, etc., are extracted from well logs, but since horizontal wells are rarely logged, other alternative sources of information should be considered. Shelley et al.6,7 proposed using data from mud logs and geology as reservoir proxies for the purpose of optimizing completion and frac design. These measurements, made during drilling operations, are indicators of hydrocarbon maturity that can be associated with reservoir and fluid characteristics. If gas counts are measured in a consistent manner, they can be used as a relative indicator of formation transmissibility and storage. Higher gas counts in wells indicate greater permeability and/or greater pore pressure than other wells with lower gas count.
For this project, parameters that could be measured during drilling operations, such as gas counts, alkane fractions, rate of penetration, mud weights, depth and average gamma ray count are quantified, and averages calculated for the completion intervals of the entire well. One of this study’s objectives is to evaluate the usefulness of these parameters in explaining why some wells produce significantly more gas than others. Development of the data-driven ANN model in this study is based on a database containing information on 48 wells, for which horizontal drilling, geochemical, lateral, completion, frac and production data were available.
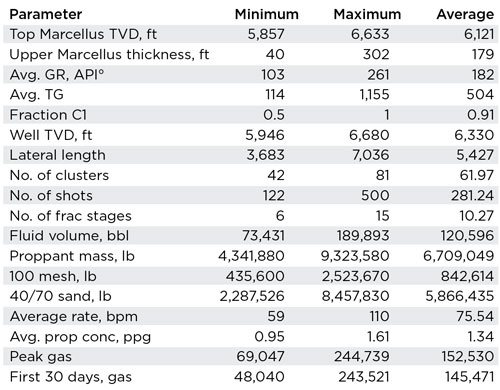
All the wells were generally drilled in a northeast-southwest direction, with the resulting, completed lateral lengths ranging from 3, 751 ft to 6, 995 ft. The wells were all cemented and utilized a plug-and-perf frac staging method. Well stimulation consisted of up to 15 treatment stages using a waterfrac type stimulation design, a combination of 100-mesh and 40/70 sand, pumped at an average rate of 75 bpm. Fluid and proppant volumes ranged up to 189,893 bbl and 9,348,543 lb, respectively. A summary of the well parameters in this database is shown in Table 1.
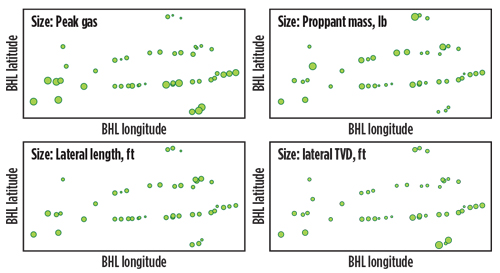
After the database is assembled, it should be examined and refined further, to pinpoint the collection of parameters that directly and/or indirectly affect well production. Figure 3 compares well locations and various completion/drilling parameters. As can be seen, most of the high-productivity wells are in the southern half of the field, yet these high-productivity wells mostly have an average lateral length, average proppant mass. However, they were drilled slightly deeper than other wells. Deeper gas wells are potentially more thermally mature and higher-pressured, which would contribute to better production. Yet, this trend does not apply to all the wells, and it is evident that other parameters or combinations of parameters affect production.
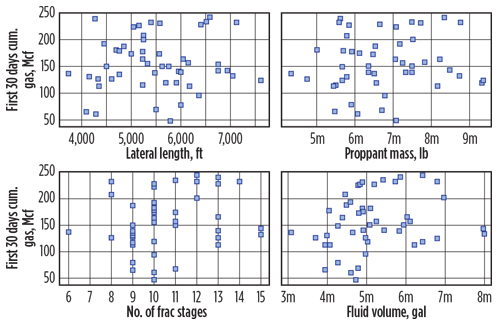
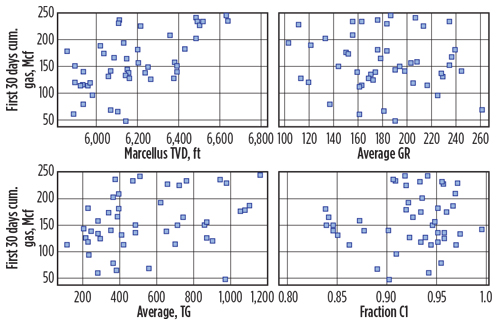
Comparing completion/frac-related data to well production resulted in very limited information about completion effectiveness, as can be seen in Fig. 4. Lateral length, proppant mass and number of treatment stages have very poor correlation to well production, while total stimulation fluid volume has only a very weak linear correlation to well production. A comparison of geology and drilling-related parameters to production is shown in Fig. 5. These parameters include the top of Marcellus TVD, average gamma ray, average total gas counts, and methane fraction. The top of Marcellus depth has a somewhat better linear correlation with well production. It is possible that for the wells in this database, depth is related to higher formation temperature, which results in greater hydrocarbon maturity. However, the relationship is not strong enough to be useful. Linear correlation for the rest of the parameters is not readily apparent and, for this reason, more sophisticated modeling techniques are required to integrate data and simplify correlations. This is necessary to extract useful information about how to improve well completion and fracturing effectiveness.
The data-driven model developed from this database is a feed-forward artificial neural network (ANN). Neural network modeling is a sophisticated technique that has been used in a variety of purposes, in numerous industries. The modeling has been used for some time to evaluate completion and frac effectiveness.6 In this application, the neural network models are trained or developed to predict a relative production indicator for wells in a database.
These models are developed for a specific purpose, in this case to predict and explain production for multi-fractured, horizontal Marcellus completions. The ANN models are trained on the information from 34 wells that have been selected randomly from the database. Genetic Algorithms (GA) evaluated various combinations of input parameters and facilitated the selection of appropriate neural network topology. A test dataset comprised of 14 wells was held back from model development for model selection (test) purposes.
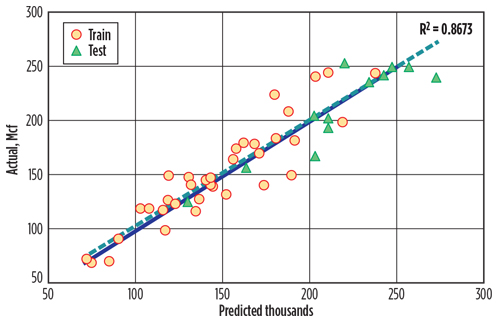
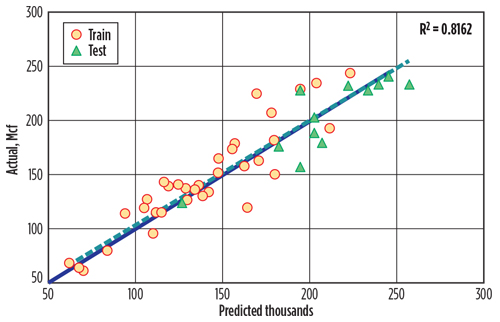
It is important to note that during the training phase, models have not adapted to the test data; therefore, the best model should be able to understand the training dataset and then evaluate this learning by determining errors in the test data to enhance predictive effectiveness for new data. Figures 6 and 7 illustrate the performance of the model on both training and testing datasets. The model predicts a peak gas (best calendar month, cumulative gas, Mcf) with a R2 of 0.87, while the R2 for first, 30-day cumulative gas is 0.82. It also should be noted that for wells in this database, peak gas has a very strong 0.88 R2 correlation to six-month cumulative gas production, which further validates it as a useful, short-term production indicator. This model only requires readily available geology, mud log information and completion/frac information, such as lateral length, frac compartment spacing, frac volume, and proppant type, among others, to predict or estimate production for a well.
ANN MODEL SENSITIVITIES
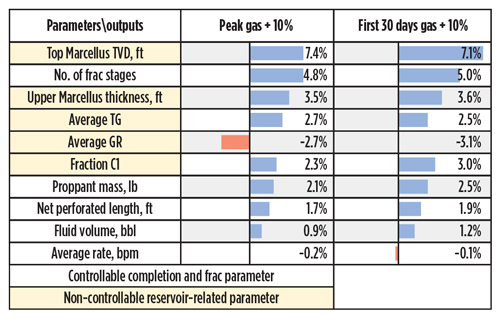
A sensitivity analysis was performed on the ANN model to determine the overall effect of each predictor on model-predicted well production. Predictor sensitivity is gauged by holding all of the predictors’ constant, except for the input parameter of interest, for which the value is increased by 10% of its range. The change in model-predicted well production is noted and compared to the base case, to determine a percent change. This process is repeated for all of the predictors required by the model. Figure 8 contains a ranking by the overall significance on production for each parameter used by the model. As can be seen, the upper half of the table is dominated by non-controllable reservoir-related parameters, such as Marcellus TVD and thickness, average total gas, average gamma ray and methane fraction.
The model’s behavior to non-controllable geology and reservoir parameters indicates that hydrocarbon thermal maturity dominates Marcellus production. This finding is consistent with information presented by Passey, et al that prospective gas zones are more thermally mature, resulting in higher pore pressure, permeability and storage. The effect of controllable completion/frac-related factors on well production is of particular interest when designing completions and frac treatments.
Modeling of this database has shown that the number of frac treatment stages is an important, controllable parameter. Generally, the model predicts higher gas production, as the number of fracture treatments increases. The next, highest impact factors are proppant mass and net perforated lateral length. It is important to note that within this database, lateral length, number of frac stages, proppant and fluid volume are correlated, and data preprocessing was required to decouple. General ANN model responses for both outputs, peak gas and first 30-day gas, are similar, as can be seen in Fig. 8.
EVALUATING EXISTING COMPLETIONS
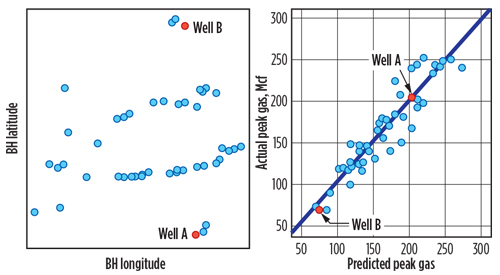
The Marcellus data-driven ANN model can be used to predict or estimate well production for alternative completion/frac designs. For this exercise, two wells are selected, both in Susquehanna County, Pa., targeting the lower Marcellus shale. Well A is in the southern part of the study area, with peak or best-month gas production of 205 MMcf. Well B is in the northern part of the study area and resulted in peak gas production of 69 MMcf. The well locations, model estimated and actual peak gas production are shown in Fig. 9.
As observed in comparing gas production for all of the wells in this study, it is evident that Well A is one of the better producing wells, while Well B is one of the lowest producing wells. The two wells are completed in a similar manner, with the major difference between the two being geology and reservoir-related characteristics. Evaluating these two wells, using the ANN Marcellus shale model, can shed light on why there is a production difference between these two wells. In addition, evaluating alternative completion and frac scenarios with the model will provide information about well potential and provide direction to improve production for future wells.
Well A was drilled in the lower Marcellus shale with a 5,565-ft horizontal lateral length. The top of the Lower Marcellus shale is at 7,409 ft, with 157 ft of thickness in the upper Marcellus. Experience and mud log measurements indicate that this well is in a prospective area, with an average 1,048 gas units recorded during horizontal drilling. This well was stimulated with 10 frac stages, using more than 6 MM lb of sand and 116,000 bbl of slick water, pumped at an average rate of 61 bpm. This completion resulted in a best-month gas cumulative of 204 MMcf and a 180-day cumulative of 1.01 Bcf. The data-driven ANN model estimation for this well, as completed by the operator, is 203 MMcf for the best-month cumulative gas, and a 0.99 Bcf, 180-day cumulative production, which is about 1% and 2% under actual, respectively.
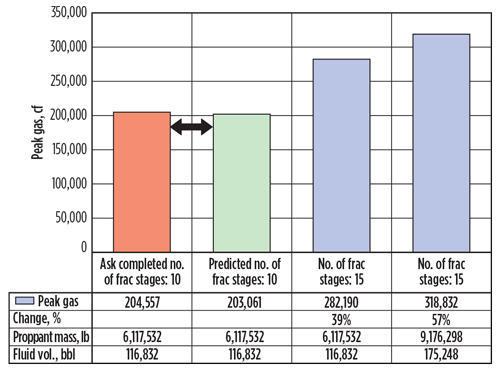
Two alternative completion scenarios were selected by the authors, to be evaluated by the ANN model. The model sensitivity analysis indicates that the most important, controllable parameters for improving well production are the number of fracture treatments, followed by the amount of proppant. Increasing the number of frac stages from 10 to 15, while keeping proppant mass and fluid volume constant in scenario A, results in more than a 39% increase in model-estimated production for Well A. This result indicates that an increase in reservoir contact, by adding more frac stages, is vital to increased gas production from this Marcellus well.
In the next scenario, B, the number of frac stages is kept at 15; however, proppant mass is increased to 9 MM lb, and fluid volume is increased to 175,000 bbl of slick water. If the operator would have implemented this completion design, according to the ANN model, peak gas production from this well would have increased 57%. This analysis indicates that Well A was under-stimulated, and if it had been stimulated more effectively by increasing the number of frac treatments, fluid volume and amount of proppant placed would have produced significantly more gas. Well data and model predictions for Well A are shown in Fig. 10.
Well B also targeted the lower Marcellus shale with 4,297 ft of horizontal lateral length. The thickness of the upper Marcellus is 164 ft, with a formation top at 5,890 ft. The operator stimulated this well in 10 stages, using over 6 MM lb of sand and 109,000 bbl of slick water, pumped at an average rate of 77 bpm, resulting in a best-month, cumulative gas production of 69 MMcf. This compares favorably with the best-month cumulative gas estimated by the ANN model of 74 MMcf, which is 7% over actual. The 180-day cumulative of 337 MMcf, estimated by the ANN model, is 12% under prediction. Errors of this amount are acceptable for these types of models, which provide a valid basis for evaluating other completion and fracing scenarios for this well.
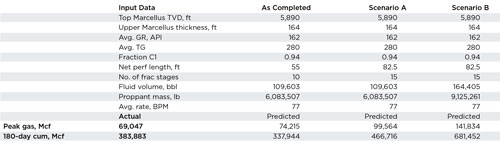
In general, sensitivities performed on the data-driven ANN model suggest that an increase in reservoir contact and conductivity would be key to unlocking more gas production from this asset. For completion scenario A, the number of frac stages is increased to 15, while proppant mass and fluid volumes are kept constant. In this case, the model predicts 34% more production from this well. In scenario B, the number of frac treatments is kept at 15, the proppant mass is increased to 9.1 MM lb, and the slick water volume is increased to 164,000 bbl.
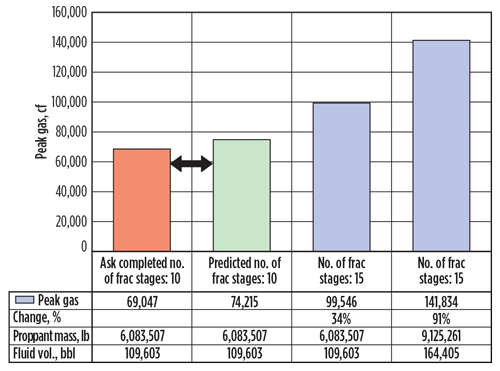
Data and model predictions for Well B are shown in Table 2 and Fig. 11. In this case, the model predicts more than a 90% increase in peak gas production. As with the Well A case study, this result indicates that Well B was also under-stimulated and, if stimulated more effectively by increasing the number of frac treatments, fluid volume and amount of proppant placed, it would have produced significantly more gas. Although the completions and fracs for Well A and B are similar, the non-controllable reservoir and geology characteristics for the two wells are not. Well A is deeper, has more total gas counts and a higher C1 fraction, which indicates better formation transmissibility and hydrocarbon maturity. Therefore, the reason that Well A produces two to three times the amount of gas as Well B is due to better reservoir characteristics.
PREDICTING A NEW COMPLETION
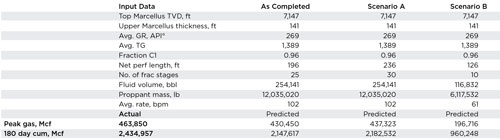
Well C is a new well, which was completed after the Marcellus ANN model had been developed. It is in Susquehanna County, to the south of Well A. Well C also targeted the lower Marcellus shale, with 6,120 ft of horizontal completion length. In addition to more lateral length, the proposed completion on Well C utilized significantly more frac stages, fluid volume and proppant compared to wells A and B. Geology and mud log parameters for Well C, and completion/frac design parameters used for stimulating, are compared to wells A and B in Table 3.
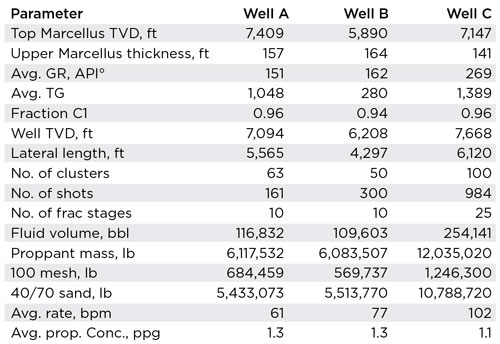
With the exception of the completion and frac design, the characteristics of this well are similar to example Well A, which proved to be more productive than Well B. Like Well A, Well C has positive geology and reservoir characteristics in terms of TVD, C1 fraction and total gas (TG), which are all well above average values for the wells in the project development database. Of particular interest are the improved controllable completion and frac design parameters, which also should contribute to better production from Well C. In addition to the lateral length being longer, this completion design utilizes significantly more frac stages, more total pumped fluid and total proppant mass. One item of note, the number of perforation clusters per frac stage has been decreased to four, and the average rate per stage has been increased to 102 bpm, in an effort to improve cluster efficiency.
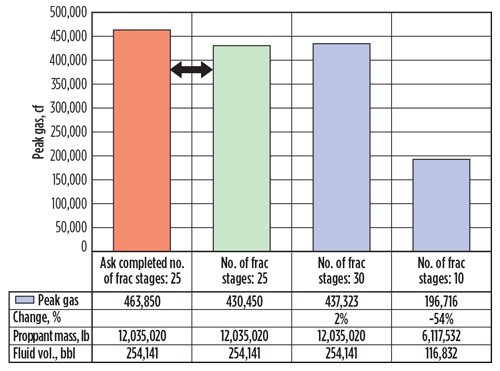
The production for Well C was estimated, using the Marcellus ANN Model. The model-predicted results for the as-completed case are shown in Table 4. The model predicts a best-month cumulative gas of 430 MMcf, which compares favorably with the actual well production of 463 MMcf, which is an under-prediction by the model of about 7%. The 2.1-Bcf, 180-day cumulative gas predicted by the model is a 12% under-prediction. These results further validate the ANN model’s usefulness for predicting production for newly fractured, horizontal Marcellus completions. The model predicted actual and production estimates for the two other completion scenarios; scenario A, a 30-stage completion, and scenario B, the same completion as that performed on Well A, are shown in Fig. 12. As can be seen, increasing the number of stages from 25 to 30 results in only a 2% model-predicted production increase for Well C. This indicates that for these stimulation volumes, 25 frac stages may be close to the optimum number. This conclusion is supported further by the model’s predicted 197 MMcf, a 54% decrease in production for a completion with 10 frac stages and the same stimulation volumes as those performed on Well A. These results also indicate that Well A’s performance would be similar to Well C, if it had the same amount of stimulation as Well C.
CONCLUSIONS
This evaluation indicates that all of the wells in this study are under-stimulated. The ANN model estimates that with more effective completion and frac designs, these wells would have produced significantly more gas during the first six months of production. Using typical type curve parameters, the higher IP30 rates achieved with the new design would significantly increase expected EURs above 10 Bcf/well for PUD locations covering a greater portion of area than currently recognized.
Geology and reservoir quality dominate Marcellus production. The data in this study indicate that gas production is dominated by depth and thickness of the Marcellus shale. In addition, measurements made during horizontal drilling operations are also indicators of Marcellus productivity. Higher average gas counts and higher average methane fractions are indicators that a wellbore penetrated better-quality rock. These two parameters are related to hydrocarbon maturity.
Controllable contact and conductivity-related parameters also affect Marcellus gas production significantly. The number of frac treatments (fracture spacing), and the amount of 40/70 sand used in the completion, rank first and second in significance. This is followed by perforation design, fluid volume and treatment rate. For wells in this study, the amount of 100 Mesh sand utilized was not needed to explain differences in well production. ![]()
ACKNOWLEDGMENT
This article is based on SPE paper 171003, presented at the SPE Eastern Regional Meeting, Charleston, W. Va, Oct. 21-23, 2014.
REFERENCES
- Arthur, J.D.; B. Bohm and M. Layne, “Hydraulic fracturing consideration for natural gas wells of Marcellus shale,” Ground Water Protection Council, Cincinnati, Ohio, 2008.
- Passey, Q. R.; K. M. Bohacs, W. L. Esch, R. Klimentidis and S. Sinha, “From oil-prone source rock to gas-producing shale reservoir,” Geologic and petrophysical characterization of unconventional shale-gas reservoirs, 2010.
- Sidahmed, M.; E. Ziegel, S. Shirzadi, D. Stevens and M. Marcano, “Enhancing wellwork efficiency with data mining and predictive analytics,” SPE paper 167869, presented at the SPE Intelligent Energy Conference & Exhibition, Utrecht, The Netherlands, April 1-3, 2014.
- MacDonald, C.; J. Brewer, M. D. Cakici, D. Rampton, K. Dick, A. Mookerjee, D. Clark and U. Ganguly, “A multi-domain approach to completion and stimulation design in the Marcellus shale,” SPE paper 168756, presented at the Unconventional Resources Technology Conference, Denver, Colo., Aug. 12-14, 2013.
- Walker, K.; K. Wutherich, I. Terry, J. Shreves and J. Caplan, “Improving production in the Marcellus shale using an engineered completion design: A case study,” SPE paper 159666, presented at the SPE ATCE, San Antonio, Texas, Oct. 8-10, 2012.
- Shelley, B. and S. Stephenson, “The use of artificial neural networks in completion stimulation design,” Computers & Geosciences, No. 26, 2000, pp 941–951.
- Shelley, R. F.; M. J. Mullen and W.A. Minner, “A North American review of commercial shale plays: Have we learned anything besides serendipity?,” SPE paper 166229, presented at the SPE ATCE, New Orleans, La., Sept. 30–Oct. 2, 2013.
- Nejad, A. M.; R. Shelley, L. Lehman, K. Shah, D. Gusain and M. Conway, “Development of the brittle shale fracture network model,” SPE paper 163829, presented at the SPE Hydraulic Fracturing Technology Conference, The Woodlands, Texas, Feb. 4-6, 2013.
- Shale technology: Bayesian variable pressure decline-curve analysis for shale gas wells (March 2024)
- Using data to create new completion efficiencies (February 2024)
- Prices and governmental policies combine to stymie Canadian upstream growth (February 2024)
- U.S. producing gas wells increase despite low prices (February 2024)
- U.S. drilling: More of the same expected (February 2024)
- U.S. oil and natural gas production hits record highs (February 2024)

