What’s new in well logging and formation evaluation—Part 2
The purpose of this article, which is based solely on published technical papers and publicly available literature, is to inform readers of new and potential technologies in well logging and formation evaluation. This article does not endorse or promote any particular technologies or service providers. Some of the technologies described in this article may be currently available as commercial services, while others may still be in the development or test phases.
BOREHOLE RESERVOIR MONITORING
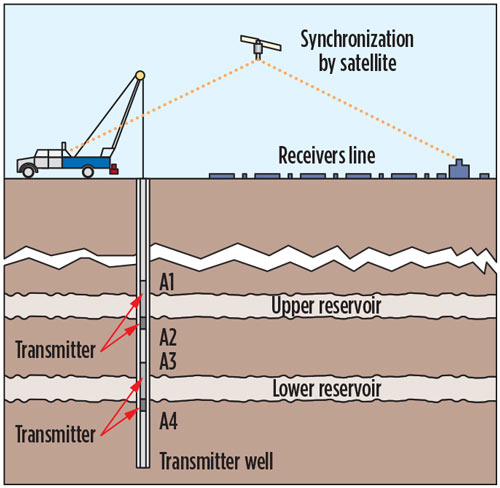
Borehole-to-surface electromagnetic (BSEM) surveys. Borehole electromagnetic (EM) geophysical methods use the presence of strong resistivity contrasts between formation fluids, such as oil and water, to map the resistivity distribution in the subsurface. This information, in turn, allows geophysical imaging of hydrocarbon reservoirs and mapping fluid distribution, and fluid saturation in a target reservoir layer. Time-lapse surveys, conducted over the life of a field, are used in reservoir monitoring to study the movement of these fluids during production or a waterflood. For example, cross-well EM techniques (see the 2009 article) are used to image and characterize the interwell region between two wells. BSEM is another EM technique that uses time- and frequency-domain EM data, acquired in a single surveyed well, to map fluid distribution of a target reservoir layer around a well. The scale of the method is partially a function of well depth, and ranges from hundreds to thousands of meters away from the transmitter wellbore. In contrast, cross-well methods require two or more wells to create cross-sectional images, over an inter-well distance of up to 1 km. Deployment of both of these methods can be expensive and logistically challenging.
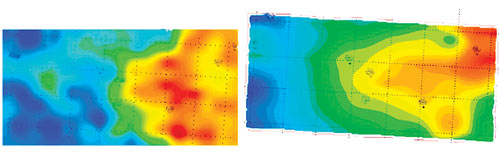
In BSEM, the transmitting electrode is in a wellbore, and the receiver arrays, comprising a grid of electrodes, are buried a few feet under the ground at the surface. The transmitting dipole consists of an ‘A’ (injection) electrode that is lowered in the well on wireline, and a ‘B’ electrode, a surface grounding point, buried close to the wellhead, Fig. 1. The ‘A’ electrode is placed at different depths, typically at the top and the bottom of the reservoir layer under investigation. Part of the electric current flows from the downhole electrode to the counter electrode through the casing, and the rest flows within the earth, generating surface EM fields that are characteristic of the electrical properties of the subsurface around the well. At the surface, a large receiver array (up to 1,000 receivers), positioned in a grid around the survey well that can extend up to 4 km from the transmitting well, measures amplitude and phase of the electric field radial component, oriented from each receiver station toward the surveyed transmitter well. After data processing, which includes data inversion, the resulting maps are used to identify oil- and water-bearing zones in the investigated reservoir layers, Fig. 2.
Saudi Aramco recently conducted successful pilot studies of BSEM in Saudi Arabia that resulted in resistivity and IP images of oil-water contacts at reservoir depth and estimates of fluid distribution that were consistent with those obtained from logs, production data and reservoir models. In addition to BSEM’s exploration potential, these maps demonstrated the potential of the method in reservoir surveillance, namely, mapping flood fronts, monitoring fluid displacement and sweep efficiency.1,2
Two new advances have the potential to reduce survey costs and to simplify deployment. The first is the development of a robust, broadband, high-impedance, capacitatively coupled sensor that provides fast data acquisition and is easily deployed (the sensor does not require burial).3 The second advance is using the in-situ well casing as a current injection electrode (source) in place of a wireline electrode. EM transmission through the earth is achieved by connecting an electrode at the wellhead and a counter electrode that is placed at the surface, several kilometers away. Two methods have been tested, one with in-well electrodes, where the current flows down the casing (deep-casing source), and the other using only surface electrodes, where the current flows up the casing (top-casing source). Both methods extended the depth of EM investigation to the depth of typical hydrocarbon reservoirs, provided a larger injected current than conventional BSEM, and proved capable of detecting fluid movement at depth. However, the top-casing source has the advantage of being very easy to configure and not requiring any downhole equipment, thus avoiding the need for a potentially costly well intervention. This method could also be used to provide permanent real-time monitoring in producing fields.4 Modeling indicates that the enhanced current flow at depth provided by using the casing as a source results in measurable signal changes for targets traditionally considered outside the capability of EM, e.g., CO2 plumes, steamfloods, water, bypassed oil, and, potentially, even hydraulic fractures.5
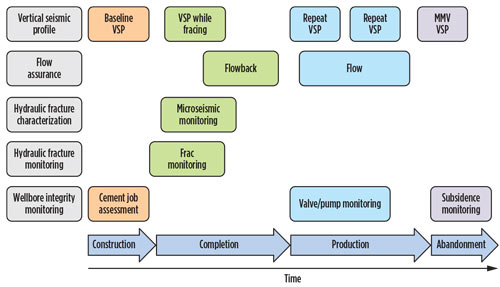
Fiber-optic sensing. Significant advances continue to be made in fiber-optic technology and data interpretation, and the range of applications of these sensors (see World Oil, July 2014, p. 81).6,7 As discussed in previous articles (see World Oil, June 2011, p. 85; July 2012, p. 107; and July 2014, p. 81), fiber-optic sensing can provide low-cost, on-demand, repeatable quantitative measurements of reservoir properties. The mode of fiber-optic conveyance may differ in exploration and production wells: Wireline conveyance might be preferred in an exploration well; while production wells would benefit from the permanent installation of fiber optics behind the casing or clamped on to the production string.8 The combined installation of distributed temperature sensors (DTS) and distributed acoustic (vibration) sensors (DAS) can provide seismic data/imaging and production logging data throughout the life of a well or reservoir (summarized in Fig. 3), at a relatively small incremental cost and without requiring expensive periodic well interventions to acquire data.9
Fiber-optic interferometers are sensitive to the orientation of the sensor.7,11 A three-component (3C) fiber-optic sensor array, in which the optic fibers are arranged to provide interferometers along the three orthogonal axes, similar to 3C geophones or accelerometers, has been developed and field-tested.12 The 3C sensor arrays are manufactured at predetermined distances (i.e., receiver levels) along the fiber. By eliminating downhole electronics, the fiber-optic sensors enable active-source seismic monitoring (e.g., VSP) and passive monitoring (e.g., microseismic monitoring of hydraulic fracturing and injection) in HPHT boreholes and in wells that are not accessible to geophones.
Ziebel, a Norwegian company, has developed two fiber-optic conveyance systems that provide temperature and acoustic profiles: 1) a composite-carbon-rod (Z-System) designed for use in long horizontal wells; and 2) a wireline gravity-deployed system (Z-Line). The 15-mm-diameter, semi-stiff carbon-rod includes a sensing tool, which consists of six optical fibers embedded in the 15-mm-diameter rod, and a bottomhole assembly (BHA). Two multi-mode fibers are dedicated to DTS, one single-mode fiber to DAS, and three single-mode fibers are dedicated to point pressure, point temperature and vibration measurements.13,14 The sensors for the pressure and temperature point measurements are in the BHA. The carbon rod comes coiled in drums of 20,000-ft lengths, and the fiber-optic sensors are rated to 10,000 psi and 302°F. The horizontal reach of the carbon-rod system is determined by the pipe’s internal diameter; the condition and roughness of the pipe’s internal surface; and the amount of debris in the hole. The gravity-deployed system, which can be run in vertical or highly deviated producing or injecting wells, employs a 4.8-mm-diameter, composite carbon line that may contain the same six optic fibers as the carbon-rod system, or fewer.
Because different companies are providing different implementations of fiber-optic systems there is a need for standardization. Energistics, a Houston-based organization and the successor to POSC, is serving as an umbrella organization for establishing a standardization code, i.e., PRODML, to enable transfer of production-related data acquired with different distributed fiber-optic systems, e.g., DTS and DAS.6
CORING AND CORE ANALYSIS
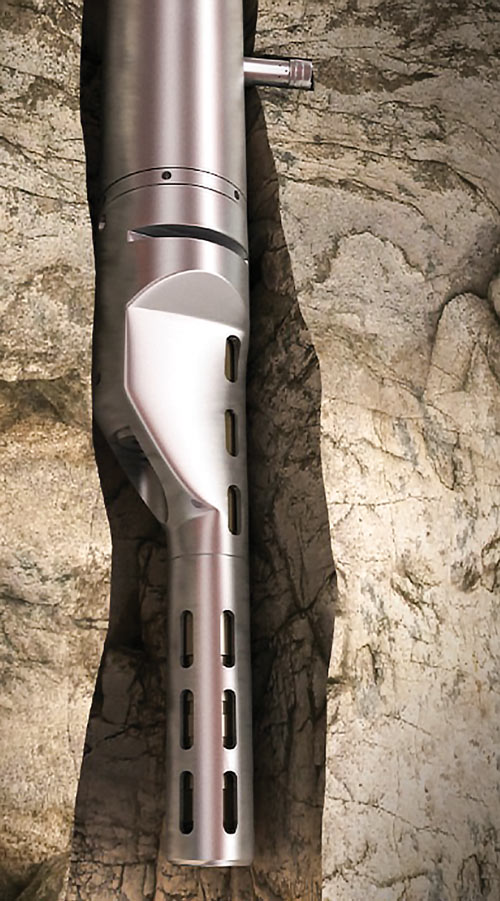
Sidewall “pressure” coring. Halliburton introduced a new core service (CoreVault), which uses pressure-tight containers to ensure the recovery of all the fluids contained in the core samples recovered by their new-generation, rotary sidewall-coring tool, Fig. 4. Preventing the loss of pore fluids, during core recovery and transport, ensures more accurate volumetric determinations of the in-place reservoir hydrocarbons. The coring system can capture up to 10 1.5- x 2.4-in. samples per trip, in a sealed container. A specialized overpack has been designed to allow safe handling and transport of the sealed, pressurized sample container. The coring system is rated to 400°F and 25,000 psi, and it can operate in borehole sizes between 6.75 in. and 12.25 in.15
Conventional-coring workflow. A recent paper presented at the Society of Core Analysts annual symposium presents a generic workflow for the acquisition of high-quality conventional cores to meet core-evaluation objectives. The workflow covers planning and operational aspects that must be considered, e.g., equipment, core preservation, transportation and storage. Two scenarios are presented: 1) unconsolidated sand for special core analysis (SCAL) tests; and 2) carbonate for routine core analysis (RCA).16 A second paper, presented at the same meeting, reviews current wax core-preservation techniques and practices, and offers recommendations for improving the preservation of whole-core and core-plug pore fluids, to help assure the reliability and representativeness of fluid-saturation measurements.17
Quality control of core measurements. Ensuring the quality of core-analysis measurements is an ongoing effort (see World Oil, July 2013, p. 71). Two recent papers discuss quality-control issues related to different laboratory measurements and offer recommendations for improving the accuracy and reliability of these measurements. The focus of the first paper is on using laboratory measurements of elemental concentrations to validate “geochemical” (elemental spectroscopy) log interpretation. This paper discusses the importance of understanding and validating core chemistry and mineralogy, typically obtained via X-ray fluorescence (XRF), inductively coupled plasma (ICP), X-ray diffraction (XRD) and Fourier-transform infrared spectroscopy (FTIR), before using them to reconcile disagreements between core and log data, and presents an in-house QC measure for assessing the quality of mineral analysis, once the quality of the elemental concentrations is established.18
The second paper discusses the measurement of porosity and fluid saturation on hydrocarbon source rocks. A comparison of three independent techniques resulted in discrepancies of up to 20%. The paper reviews possible reasons for these discrepancies, e.g., equipment-related or procedural, and proposes different technical solutions. In addition, the authors present guidelines and recommendations to improve the accuracy of total porosity, grain density and water saturation measurements.19
LABORATORY ANALYSIS
Digital rock physics. Traditional core analysis, both RCA and SCAL, can be expensive and time-consuming, particularly for relative permeability and pore-pressure measurements. DRP delivers a rapid and cost-effective solution for estimating macroscopic rock properties (e.g., porosity) and pore-scale properties (e.g., permeability and fluid transport dynamics) in rock samples, at scales ranging from whole-core and core plugs down to the subpore (nanometer) scale. This capability can result in an improved understanding of reservoir petrophysical and flow properties, in terms of rock type, pore structure, texture, and interconnectivity that can lead to improved predictions of reservoir performance and, ultimately, to greater hydrocarbon recovery.
DRP combines core-imaging techniques, e.g., scanning electron microscopy (SEM) and 3D X-ray computed tomography (CT), with advanced, multiphase, 3D flow modeling and simulation capability. The DRP workflow involves digital imaging to resolve pore-scale features, processing the images to separate the pore phases from the mineral matrix, and simulating physical process within the 3D model to determine effective static and dynamic rock properties, e.g., permeability (absolute and relative), electrical resistivity, and the elastic moduli, in the microstructural model.20
The SEM methods, typically, include high-resolution backscattered electron imaging (BSE), low-resolution energy-dispersive spectroscopy imaging (EDS), and high-resolution focused ion-beam (FIB) imaging, along with associated image analysis and 3D visualization software (see World Oil, July 2012, p. 107; and July 2014, p. 81). These imaging techniques provide textural information, such as grain and pore size, and specific surface area, which allows for the estimation of porosity and permeability, and information about the mineralogy and chemical composition of core-plug and cuttings samples, at different resolutions in a relatively short period of time.
Digital imaging includes multi-scale computed tomography (CT) and micro-CT, and provides 3D images of the spatial distribution of grains, pores, and pore fluids of the whole core and core plugs. Similar to the microscopy techniques, these images can be used for estimating rock properties, such as porosity, permeability, pore-size distribution, effective elastic moduli, and electrical conductivity, but at a higher resolution. Integrating imaging data acquired at different resolutions (scales) helps to improve the reliability of the results. Advanced, multiphase, 3D flow modeling and simulation capability allow 3D characterization of the mineralogy, pore structure and flow processes of conventional and complex reservoir rocks, ranging from the centimeter to the nanometer scale.
The advantages and value of DRP were discussed in a recent paper by BP geoscientists.21 The company conducted extensive field trials, involving static rock-property measurements (e.g., porosity, permeability, formation factor, cementation export, saturation exponent, resistivity index and capillary pressure) and measurements obtained using DRP technology. These results were compared with the results obtained using traditional laboratory methods. The project involved conventional reservoirs (permeability ≥1 mD). The authors concluded that DRP technology can improve evaluation of reservoir quality and quantification of hydrocarbons-in-place, while reducing the cycle time for appraisal and reducing uncertainty in subsurface description. However, the technology must be fully proven and validated—the ability to use an existing in-house database of similar measurements obtained using the traditional methods is “essential for enabling a methodical and thorough validation of this new technology.”21
In general, DRP-derived trends and relationships, such as porosity versus permeability, and acoustic-wave velocity versus porosity, are in very good agreement with laboratory results at larger scales.20 However, operating companies have had different experiences with DRP. Several recently published studies have advised caution in using DRP as an alternative for laboratory measurements. DRP is still an evolving technology, and the prediction of effective properties can be affected by a number of factors, including sample bias and the choice of modeling and simulation parameters.22,23 Due to differences in scale (i.e., representative volumes) between DRP techniques and laboratory measurements, current imaging techniques may not fully characterize the microstructural details of a rock sample, especially heterogeneous rocks, such as carbonates, and this can result in discrepancies (i.e., mismatches) between numerical estimates of mechanical properties, based on micro-CT images and laboratory-derived data.20,23 One recent study of a Middle East carbonate reservoir found significant scatter in DRP predictions that did not exist in the SCAL data, and that could not be attributed to sample heterogeneity; a second study found that, regardless of the approach used, all of the numerical predictions overestimated the bulk modulus measured in the laboratory.24,25
In contrast, another study involving carbonate reservoirs in a giant Middle Eastern field achieved excellent agreement in DRP-predicted and laboratory-derived dynamic rock properties.26 DRP capillary-pressure and relative-permeability measurements were made at full reservoir conditions on whole-core subsamples (core plugs). The DRP results were upscaled as whole-core composites, to enable comparison with laboratory SCAL results obtained previously on core plugs from the same reservoir. The SCAL measurements required six years, while the DRP measurements were completed in six months. DRP also allowed the investigation of various wettability scenarios and their impact on the relative permeability results, in a timely manner, i.e., within months rather than years.
Within the past few years, the emerging technology of digital rock physics has moved out of academic and operating company research labs (see 2006 article), and become a viable commercial service provided by specialized companies and major oilfield service companies. Some companies may only provide the digital imaging and core/pore-network visualization that enables predictions of static rock properties, while others also provide modeling of dynamic rock properties (fluid transport).
Schlumberger recently introduced its digital rock and fluid analytics service (CoreFlow). This new service combines physical core analysis, and digital analysis of rock and fluid properties, with a new direct, hydrodynamics (DHD), multiphase, compositional pore-scale flow simulator in a single integrated workflow that encompasses rock and fluid characterization, simulation and validation. Both the physical laboratory and digital techniques are applied in the same facility, on the same rock samples. The characterization phase includes measurements of basic fluid, rock and fluid-rock properties, including PVT data, rheology, fluid-fluid and rock-fluid interaction data, and rock morphology. The simulation phase, which combines digital rock models, digital fluid models, 3D wettability distribution, and setup of boundary conditions, measures capillary pressure, relative permeability, recovery efficiency, and flow heterogeneity, by stimulating fluid flow through porous media, i.e., investigating rock-fluid and fluid-fluid interaction dynamics. The simulator, which has been benchmarked against physical models and real rocks, accurately simulates the flow of complex multiphase, multicomponent fluid flow through digital rock models while honoring real pore geometries, even at very fine scales. This enables evaluation of the effect of mixed wettability, complex rheologies of fluid phases, and changes in saturation during the production cycles, as water drives production. In the validation phase, predicted digital core properties are compared and validated by laboratory measurements on the same core plugs.27
SEM-based imaging techniques. The presence of matrix-dispersed microcrystalline quartz (chert) cement in mudrocks can have a significant impact on rock brittleness, a mechanical rock property used in the design of fracturing jobs. To estimate the amount of chert cement, it’s necessary to distinguish it from authigenic or detrital quartz that also may be present; however, bulk chemical and mineralogical analyses may not readily provide this information. Cathodoluminescence imaging is sensitive to subtle contrasts in trace-element composition and crystal defects, and this information can be used to discriminate the different types of quartz that are present.28 In this SEM-based technique, a focused beam of electrons impinges on a polished, thin-section sample and induces it to emit light that is collected by an optical system. The sample is scanned with the beam, and the light emitted at each point is measured to create a map of the optical activity. Variations in cathodoluminescence color and intensity indicate contrasts in crystal defects and trace elemental composition. This information is used in conjunction with information on crystal size, crystal shapes, and fabric, to identify different quartz types in mudrocks.
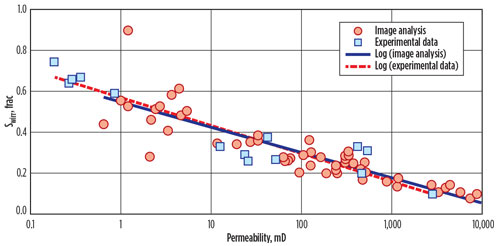
Estimates of irreducible water saturation (Swirr) obtained from analysis of BSE-SEM images of reservoir rock thin sections, give a good match with results obtained using laboratory porous-plate capillary-pressure methods, Fig. 5.29 The basis for this approach is that Swirr is linked closely to the smallest pores (typically related to authigenic clays) in the reservoir rock and the amount of these pores can be estimated from the BSE images. The technique offers a fast, cost-efficient and reliable way to estimate Swirr of siliciclastic reservoir rocks.
Applications of 3D printers in core evaluation. Complimenting the development of DRP imaging techniques is a novel application of the emerging 3D-printer technology. These printers are being used to create physical models from virtual CT-image-based models of rock cores and pore networks, i.e., to replicate textural and petrophysical properties of porous rocks to aid in visualization and to improve understanding of the factors that affect fluid flow at different scales. The resolution of the pore networks that can actually be printed is limited by the capability of current 3D printers. One long-term objective is to subject these 3D-printed physical models to laboratory-based physical measurements, to help validate the DRP-based porosity and pore-connectivity predictions of real and artificial rocks.30,31
Drill-cuttings evaluation. A methodology has been developed that allows a complete petrophysical evaluation of wells in low-permeability formations based solely on drill cuttings. The objective of this approach is to complement conventional well-log and core-based petrophysical analysis, and to offer an alternative method for petrophysical evaluation in wells where well logs and core data are unavailable. The proposed methodology requires good-quality cuttings, between 1 and 2 mm in size, and employs a combination of laboratory analyses (porosity and permeability), and empirical correlations with petrophysical properties and parameters. The method allows quantitative evaluation of water saturation, pore-throat aperture, capillary pressure, flow units, porosity (or cementation) exponent m, true formation resistivity, and distance to a water table (if present). In addition, the method allows construction of Pickett plots without previous availability of well logs, and estimations of geomechanical properties, such as Poisson’s ratio, Young’s modulus and brittleness index. The method has been tested in Western Canada tight sandstone, and it provided good results.32,33 ![]()
REFERENCES
- Marsala et al., “Fluid distribution inter-well mapping in multiple reservoirs by innovative borehole to surface electromagnetic: survey design and field acquisition,” IPTC paper 17045, presented at the International Petroleum Technology Conference, Beijing, China, March 26−28, 2013.
- Marsala et al., “First borehole to surface electromagnetic survey in KSA: Reservoir mapping and monitoring at a new scale,” SPE paper 146348, presented at the SPE Annual Technical Conference and Exhibition, Denver, Colo. Oct. 30−Nov. 2, 2011.
- Hibbs et al., “New electromagnetic sensors for magnetotelluric and induced polarization geophysical surveys,” Paper MG 1.8, SEG Annual Meeting Technical Program Expanded Abstracts, pp. 1−5, 2012.
- Marsala et al., “Borehole casing sources for electromagnetic imaging of deep formations,” SPE paper 170845, presented at the SPE Annual Technical Conference and Exhibition, Amsterdam, The Netherlands, Oct. 27−29, 2014.
- Hibbs et al., “Advances in electromagnetic survey instrumentation and the use of a cased borehole for imaging a deep formations,” Paper WS9-C05, presented at the EAGE 76th Conference and Exhibition, Amsterdam, The Netherlands, June 16−19, 2014.
- Jacobs, T., “Downhole fiber-optic monitoring: An evolving technology,” Journal of Petroleum Technology, 66(8), pp. 44−53, 2014.
- Mateeva et al., “Distributed acoustic sensing for reservoir monitoring with vertical seismic profiling,” Geophysical Prospecting, 62(4), pp. 679−692, 2014.
- Frignet, B.G., and A.H. Hartog, “Optical vertical seismic profile on wireline cable,” Paper FFFF, Transactions, SPWLA 55th Annual Logging Symposium, Abu Dhabi, UAE, May 18−22, 2014.
- Zett, et al., “A case study of optical sensing applicability in reservoir surveillance—the non-unique solution dilemma,” Paper P, Transactions, SPWLA 55th Annual Logging Symposium, Abu Dhabi, UAE, May 18−22, 2014.
- Hill, D.J., “Distributed acoustic sensing for permanent downhole monitoring,” Paper Th-01-05, presented at the 2nd EAGE workshop on permanent reservoir monitoring 2013—Current and future trends, Stavanger, Norway, July 2−5, 2013.
- Papp et al., “Fundamentals of vibration sensing with distributed fibre optic sensors though downscaled experiments,” paper Th-ELI2-09, presented at the 76th EAGE Conference and Exhibition, Amsterdam, The Netherlands, June 16−19, 2014.
- Karrenbach, et al., “Field testing a three-component, fiber-optic borehole seismic array,” paper VSP 1.3, SEG Annual Meeting Technical Program Expanded Abstracts, pp. 5019−5023, 2014.
- Hensen, et al., “Successful deployments of a new well-intervention methodology in horizontal wellbores,” SPE paper 121459, presented at the 2009 SPE/ICoTA Coiled Tubing and Well Intervention Conference and Exhibition, The Woodlands, Texas, March 31−April 1, 2009.
- Danardu, et al., “Data acquisition and processing of carbon rod-conveyed DTS and DAS in very long horizontal wells: First trial in North Sea Danish sector,” SPE paper 170663, presented at the SPE Annual Technical Conference and Exhibition, Amsterdam, The Netherlands, Oct. 27−29, 2014.
- Halliburton, “CoreVault fluid and rock sampling service,” Sales Brochure H011158, 2014.
- Gay, M., “A coring matrix for success,” paper SCA2014-086, presented at the Society of Core Analysts International Symposium, Avignon, France, Sept. 8−11, 2014.
- Roussell, M., J.-V. Garcia and M. Gay, “Wax core preservation—extended review of existing methodologies,” paper SCA2014-097, presented at the Society of Core Analysts International Symposium, Avignon, France, Sept. 8−11, 2014.
- Herron, et al., “Application and quality control of core data for the development and validation of elemental spectroscopy log interpretation,” paper LLL, Transactions, SPWLA 55th Annual Logging Symposium, Abu Dhabi, UAE, May 18−22, 2014.
- Le Bihan, et al., “Quality control of porosity and saturation measurements on source rocks,” paper MMMM, Transactions, SPWLA 55th Annual Logging Symposium, Abu Dhabi, UAE, May 18−22, 2014.
- Dvorkin, et al., “Relevance of computational rock physics,” Geophysics, 76(3), E141−E153, 2014.
- Fredrich, et al., “Digital rocks: Developing an emerging technology through to a proven capability deployed in the business,” paper SPE-170752, presented at the SPE Annual Technical Conference and Exhibition, Amsterdam, The Netherlands, October 27−29, 2014.
- Mishra et al., “Effectiveness of digital rock physical laboratories in characterization of heterogeneous and complex carbonates—A synthesis,” paper IPTC-14500, presented at the International Petroleum Technology Conference, Bangkok, Thailand, Feb. 7−9, 2012.
- Andra, et al., “Digital rock physics benchmarks—Part II: Computing effective properties,” Computers & Geosciences, 50, pp. 33−43, 2013.
- Guice, et al., “An evaluation of digital rock physics technology for the prediction of relative permeability and capillary pressure for a Middle Eastern carbonate reservoir,” paper IPTC-17288, presented at the International Petroleum Technology Conference, Doha, Qatar, Jan. 20−22, 2014.
- Saenger, et al., “Digital carbonate rock physics,” paper RP E-P1.1, SEG Annual Meeting Technical Program Expanded Abstracts, pp. 2915−2919, 2014.
- Koronol, et al., “Capillary pressure and relative permeability assessment on whole core samples from a giant Middle Eastern carbonate reservoir, utilizing digital rock physics,” SPE paper 171851, presented at the Abu Dhabi International Petroleum Exhibition and Conference, Abu Dhabi, UAE, Nov. 10-13, 2014.
- Nadeev, A., and D. Klemin, “Inside the rock,” GeoExpro, 11(5), pp. 32−35, 2014.
- Milliken, K. L., “SEM-based cathodoluminescence imaging for discriminating quartz types in mudrocks,” SPE paper 168851, presented at the Unconventional Resources Technology Conference, Denver, Colo., Aug. 12−14, 2013.
- Lopez, et al., “Thin section image analysis for estimation of initial water saturation in siliciclastic reservoir rocks,” paper SCA2013-070, presented at the Society of Core Analysts International Symposium, Napa Valley, Calif., Sept. 16-19, 2013.
- Ishutov, S., and F. Hasiuk, “3-D printing artificial reservoir rocks to test their petrophysical properties,” AAPG Search & Discovery, Article No. 41427, 2014. http://www.searchanddiscovery.com/documents/2014/41427ishutov/ndx_ishutov.pdf. Accessed March 16, 2015.
- Maslin, E., “The third (3D) industrial revolution?” Offshore Engineer, 39(10), pp. 44−49, 2014.
- Ortega, C., and R. Aguilera, “Potential impact of drill cuttings on the design of multi-stage hydraulic fracturing jobs in tight gas formations,” paper XXX, Transactions, SPWLA 53rd Annual Logging Symposium, Cartagena, Colombia, June 16−20, 2012.
- Ortega, C., and R. Aguilera, “A complete petrophysical evaluation method for tight formations from drill cuttings, only in the absence of well logs,” SPE paper 161875, SPE Journal, 19(4), pp. 1−12, 2013.
- Quantum computing and subsurface prediction (January 2024)
- Machine learning-assisted induced seismicity characterization of the Ellenburger formation, Midland basin (August 2023)
- What's new in exploration (March 2023)
- Seismic and its contribution to the energy transition (January 2023)
- What's New in Exploration: Rocks can save or kill the planet (July 2022)
- Processing of a large offshore 3DVSP DAS survey in a producing well (June 2022)
- Applying ultra-deep LWD resistivity technology successfully in a SAGD operation (May 2019)
- Adoption of wireless intelligent completions advances (May 2019)
- Majors double down as takeaway crunch eases (April 2019)
- What’s new in well logging and formation evaluation (April 2019)
- Qualification of a 20,000-psi subsea BOP: A collaborative approach (February 2019)
- ConocoPhillips’ Greg Leveille sees rapid trajectory of technical advancement continuing (February 2019)

