 |
| Results of tight oil water- and gasfloods were analyzed, to gain a better understanding of the subsurface parameters that have the most significant impact on performance. |
|
Due to the combined technological advances in horizontal drilling and hydraulic fracturing, low-permeability sandstone (tight) and shale reservoirs have become economically viable production sources in North America over the past decade. Thousands of horizontal wells have been drilled into such unconventional reservoirs, allowing another, lower-quality tier of reservoir to be accessed. While these low-permeability resources offer vast potential reserves, the oil and gas trapped within cannot be extracted effectively without significant development costs, and further technology advancements that reduce uncertainty and extend the productive life of the well, Fig. 1.
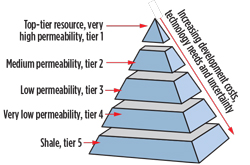 |
| Fig. 1. Oil resource pyramid. There are large volumes of potential reserves as we move to lower-quality resources, but they require more technology to develop them. |
|
A major problem plaguing many tight reservoir wells is the limited drive energy available from primary recovery methods, which employ near-wellbore stimulation methods (hydraulic fracturing). Industry-wide, the decline rate is steep in tight oil wells, with the average production rate dropping 60% or greater in the first year, due to transient effects, pressure depletion and increasing gas saturation, Fig. 2. Without some means of secondary recovery to overcome the lack of natural drive energy in the reservoir, recovery factors will remain low—on the order of the 5-10% original oil in place (OOIP)—with primary production methods, alone.
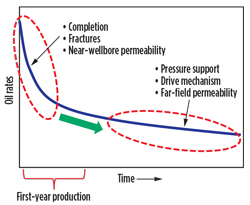 |
| Fig. 2. A typical oil rate decline curve for a tight reservoir well shows a sharp drop during the first year of production. Secondary recovery methods will become critical to maintaining a higher plateau oil rate. |
|
This article discusses the performance of waterfloods and gasfloods as a means of secondary recovery in tight oil reservoirs. A review of both field performance data and simulation work on waterfloods and gasfloods is discussed, as well as the criteria for waterflooding or gasflooding tight, low-permeability reservoirs (0.01-1 mD).
WATERFLOODING A TIGHT RESERVOIR
Several operators in North America have embarked on waterflood pilots in tight oil wells, with promising results. Baker Hughes analyzed the results of some of these waterfloods, to attempt to gain a better understanding of the subsurface parameters, and which ones had the most significant impact on performance.
One set of pilots was conducted in the Viewfield Bakken, a tight oil play in southern Saskatchewan, characterized by a porosity of 12%, an average air permeability of 1 mD, and a water saturation of 35%. There were more than 1,000 wells in this region, all horizontal wells with multiple, hydraulically stimulated zones.
For the purposes of this discussion, the waterflood results of one pilot well are presented, Fig. 3. A single injector well (roughly 1,350 m long) was tied to four horizontal producers, two north, and two south, of the injector. The producers were hydraulically fractured. These five wells were drilled in 2006, and reached a peak oil rate of 450 bpd in late 2006, before rapidly dropping off to approximately 180 bpd. The producer well count in the area remained constant at four wells, after 2007.
 |
| Fig. 3. Map Of Viewfield Bakken (left) shows the central injector well (white circle with a red border) flanked by two producers to the north and two to the south. All wells were hydraulically fractured, although data are limited to two wells. |
|
Figure 4 shows the response to waterflooding. An initial waterflood conducted in 2007 helped to level off the oil rate, but this was short-lived. Because the injection rate was stopped temporarily, the oil rate dropped to 20 bpd by mid-2008.
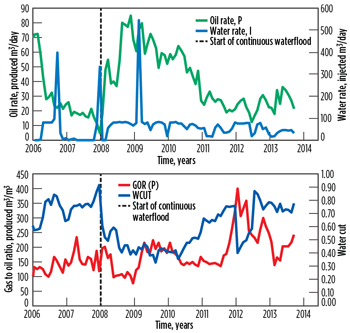 |
| Fig. 4. Waterflood results in the Viewfield Bakken, with one injector and four producers. Prior to the onset of sustained water injection in late 2008 (blue line), the total oil rate from four producers dropped substantially (top graph). Once the waterflood trial began, oil production climbed dramatically to roughly 540 bpd (top graph), while the water cut in the produced fluids dropped (bottom graph), indicating that water injection was targeting high oil-cut zones. The GOR increased slightly, but water injection still seems to have limited further increases. |
|
In late 2008, another water injection trial began with the injection of 2,300 bpd. The producer wells responded quickly, with the oil rate rebounding and reaching approximately 540 bpd by mid-2009. At the same time, the water cut in the produced fluids dropped, most likely because the zone of interest was pressurized up and flow streamlines shifted under waterflood, compared to primary production. This streamline shift produced more oil, relative to produced water, which was coming from other zones.
Results from the other waterflood pilots in the Viewfield Bakken show the same general trend, with water injection extracting significant remaining reserves from the reservoir. Without water injection, oil rates would drop quickly, to the point that the producing wells would no longer be considered economical. The results from field pilots and simulation models suggest that water injection into these low-permeability reservoirs, using horizontal multi-fractured wells, can increase recovery by a factor of two, compared to primary recovery methods, alone.
MODELING BEHAVIOR
While the field performance data suggested a strong positive response to fluid injection, Baker Hughes was unable to narrow down the variables responsible for this response, due to the number of recompletions performed on wells in this area, and the extremely small sample size. Spacing between the injector and closest producers was 200 m, and increased to 400 m for the outer two production wells. This led to the development of a model that could simulate waterflooding accurately in this tight reservoir.
This process began with a “mental model” that theorized how waterflood response might differ in a conventional versus tight reservoir. In a low-permeability reservoir (permeability of 10mD or lower), the waterflood signature is substantially different than in a conventional waterflood, as shown in Fig. 5. In a low-permeability reservoir with low oil viscosity, and therefore, with a very favorable mobility ratio, the injectors, initially, cannot inject enough water to keep up with the producers. Regulations prohibit injection pressures from exceeding the fracture gradient or in-matrix regime. Thus, even with injection, the reservoir pressure continues to decline. Therefore, the peak oil production rate, at the onset of water injection, is more subtle than a conventional waterflood in a depleted reservoir. However, as reservoir pressure declines, the injectivity of the injectors continues to increase. This eventually results in an equilibrium, where reservoir pressures stay constant, resulting in a plateau of oil production.
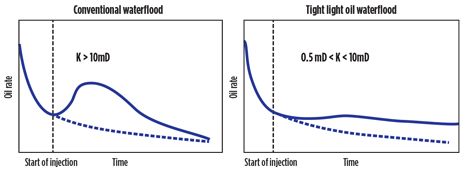 |
| Fig. 5. Mental model showing a comparison of typical waterflood responses in a conventional reservoir, with permeability above 10 mD, at left, and a tight oil reservoir, with permeabilities ranging from 0.5 to 10 mD, at right. |
|
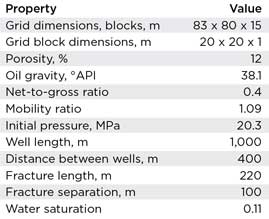
Baker Hughes then ran a number of simulations that aimed to model waterflood response in tight oil reservoirs, and how changes to key reservoir parameters would impact the outcome. The general model described a situation of one water injector spaced evenly at 400 m between producers, Fig. 6. Table 1 highlights the typical Pembina Cardium reservoir parameters used as inputs, which were readily available and obtained from public databases. The box model (schematic) simulation used average properties of the area, similar to areas that are near locations with multi-fractured horizontal wells (for our box model—schematic—simulation).
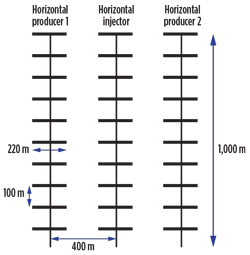 |
| Fig. 6. General schematic of waterflood scenario in the simulation model, showing a horizontal injector (center) and horizontal producers, spaced 400 m from each other. The model included two additional horizontal producers, placed 400 m behind and in front of the injector, which are not shown for clarity. |
|
| Table 1. Reservoir properties used for the waterflood simulation model. |
|
|
Additional parameters included injecting a bottomhole pressure (BHP) constraint of 27 MPa, producing a BHP constrained to 5 MPa, and fractures put in through all layers (15 layers at ~6 m). Water injection was started on day one of the simulation, and forecasts were run for 30 years.
The primary production case for 1mD is not shown in the graphs, but the incremental recovery, due to water injection, is approximately the same as primary production. Various simulations were then run to determine how secondary recovery would respond to changes in variables, including permeability, induced fracture half-length, fracture spacing and fracture conductivity.
Sensitivity to matrix permeability. For this work, model parameters were set at a fracture half-length of 100 m, fracture spacing at 100 m, placement of five wells per section, and a fracture conductivity of 2. Four cases were run with matrix permeabilities of 0.01, 0.1, 1.0 and 10 mD, respectively. Figure 6 shows the well layout and dimensions.
The simulations suggest that cumulative oil production is highest for a matrix with a permeability of 10 mD, and declines dramatically as the permeability drops toward 0.01 mD, as expected, Fig. 7. At the same time, the reservoir pressure drops quickly, and sharply, for the highest permeability case, and demonstrates a much more gradual, and prolonged, transient pressure stabilization for low-permeability cases, Fig. 8.
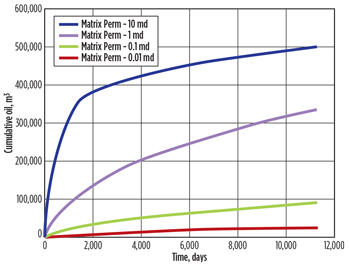 |
| Fig. 7. Cumulative produced oil comparison at different matrix permeabilities. |
|
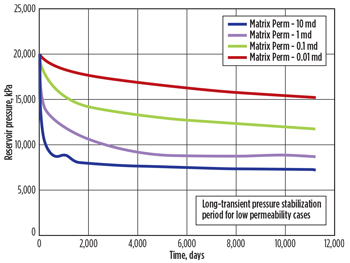 |
| Fig. 8. Reservoir pressure comparison at different matrix permeabilities. |
|
Sensitivity to fracture half-length. In this set of simulations, the parameters were kept the same as above, but with matrix permeability set to 1 mD, and fracture half-lengths of 60 m, 140 m, 180 m and 200 m, respectively. The last length approximated a situation, where the fractures between the injector and producer would be close enough to touch.
The simulation results suggest that cumulative oil production increases with fracture half-length, Fig. 9. Production from the simulation model is from one injector and two producers. However, there is not as dramatic a difference in production with length, as there was in the first set of simulations that examined permeability. Cumulative water production tells a different story, with water breakthrough occurring much faster at larger fracture half-lengths. The 60-m case showed negligible water production during the elapsed simulation time, Fig.10.
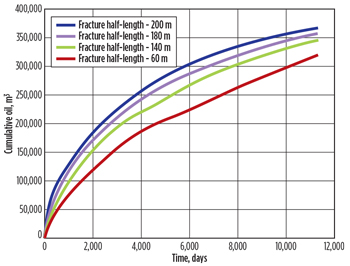 |
| Fig. 9. Cumulative produced oil as a function of fracture half-length. |
|
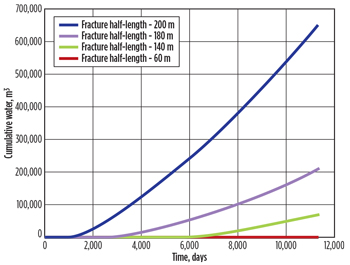 |
| Fig. 10. Cumulative water production as a function of fracture half-length. |
|
Sensitivity to fracture spacing. This set of simulations investigated the impact that fracture spacing (at 60 m, 140 m and 200 m) would have on cumulative production. Other parameters were kept constant, with a matrix permeability of 1 mD and a fracture half-length of 100 m. As Fig. 11 shows, there is very little difference in cumulative oil production between these three fracture spacings. A separate simulation, run with a spacing of 100 m but without waterflood, produced a dramatically lower production rate than any of the other three runs, which demonstrates the importance of waterflood injection in sustaining production.
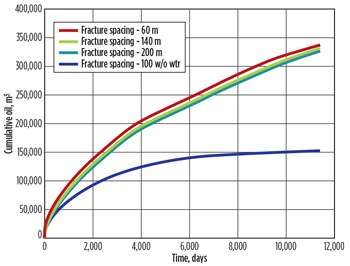 |
| Fig. 11. Cumulative oil production as a function of fracture spacing. While little difference is observed in the three waterflood simulations, the simulation run with 100 m and no water injection demonstrated low production rates. |
|
IMPACT OF WATERFLOOD-INDUCED FRACTURING
Waterflood-induced fracturing can occur in situations, where the injection rate exceeds production rates. These are slow-growing, low-pressure shear fractures that typically occur along joints or planes of weakness. While injecting water above fracture gradients may lead to short-term gains in production, industry experience suggests that high injection pressure may eventually lead to long-term loss, particularly in low-permeability reservoirs. Higher injection rates result in higher pressures that serve to extend hydraulic fractures, leading to communication with nearby wells and, thus, a drop in overall production rates. Unintended fracturing may also introduce cold injection water into hotter parts of the formation, which can lower oil viscosity and negatively impact its flow to the producer.
Waterflooding low-permeability reservoirs is, thus, a balancing act between trying to get enough water injection into the formation and to maintain reservoir pressure, and at the same time, keeping waterflood-induced fractures at smaller lengths. If the induced fractures are not held to smaller lengths, the risk of leakoff into these fractures increases, which may lower the sweep efficiency from the injector to the producer.
COMPARING WATERFLOOD AND CO2 FLOODING
The above example clearly shows that there is a limit on the value of matrix permeability for waterflooding. Our economic analysis is that waterflooding is not feasible in reservoirs with permeability lower than 0.5 mD. Gas injection has a big advantage, because its viscosity is much lower than the water viscosity. More gas can be injected, and therefore, the reservoir pressure stabilizes earlier.
Although CO2 flooding is a relatively young technology compared to waterflooding, it is growing in usage as an EOR technique, particularly for very low-permeability formations (0.5 mD and below). To compare the effectiveness of CO2 flooding vs. waterflooding in the Pembina Cardium reservoir, a simulation was run for a CO2 flood at the same reservoir conditions as the previous waterflood simulations. The resorvoir paramerter selected included a matrix permeability of 1.0 mD, fracture half-length of 100 m, fracture spacing at 100 m, placement of four wells per section, and a fracture conductivity of two.
Compared to waterflooding, gas injection resulted in higher overall cumulative oil production throughout the simulation run time at this permeability, Fig. 12. This result is not universal, but rather it depends on several parameters, including the matrix permeability.
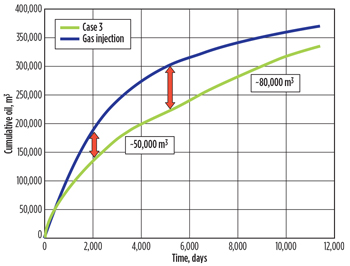 |
| Fig. 12. Comparison of cumulative oil production achieved via CO2 flooding vs. waterflooding in a reservoir with matrix permeability of 1 mD and a fracture length of 200 m. While gas injection yields the greatest cumulative production during the entire run time of the simulation, the gap narrows beyond approximately 5,500 days (15 yrs). |
|
CONCLUSIONS
The success or failure of secondary recovery in a low-permeability reservoir depends on several factors, including matrix permeability, oil viscosity, induced-hydraulic fracture length, growth of fractures during injection, stress orientation and, more importantly, reservoir management.
The results from field pilots and simulation models suggest that water injection into these low-permeability reservoirs, using horizontal multi-fractured wells, can increase recovery by a factor of two, compared to primary, alone. The well configuration allows us to develop reservoirs with lower permeability compared to vertical well configuration. However, it is important to manage water and gas injection rates to keep reservoir pressures below the threshold, where flood-induced fractures begin. Failure to manage this properly may result in short-circuiting, where the fracture network of adjacent wells comes into contact, resulting in lower overall oil production and increased water production rates.
Finally, one must be aware of the pitfalls of delaying the start of secondary recovery, as the longer the wait, the lower the incremental recovery will be. Waiting until payouts are achieved via primary production may hinder ultimate recovery levels. By running simulations, such as those presented in this article, it is possible to gain a better understanding of the reservoir and its drive mechanism, which helps to pinpoint the primary depletion forecast for the field. This helps to set the stage for well-planned and optimally timed secondary recovery processes, which should be in place before they are needed, regardless of what the most optimistic, primary recovery profile might suggest. 
|


