CARL W. NEUHAUS, CHERIE TELKER and MARY ELLISON, MicroSeismic, Inc.; and KEITH BLAIR, Gastar Exploration, Ltd.
 |
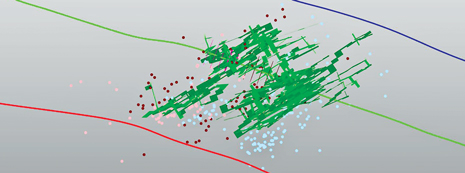
| Map view of the base case model of the reactivated natural fractures during stimulation used for treatment optimization modeling. The contiguous lines represent wellbores. The microseismic data are shown as colored dots. Fracture planes are shown in green. |
|
Over the past decade, the use of microseismic monitoring, to optimize the completions and hydraulic fracturing stimulation treatments of complex unconventional reservoirs, has evolved into a widely accepted industry practice. The emergence of microseismic surveys has become especially pronounced in heavily fractured, ultra-low-permeability shale reservoirs, where the fractures created during hydraulic stimulation deviates greatly from the planar bi-wing textbook example that has long been the industry’s accepted image.
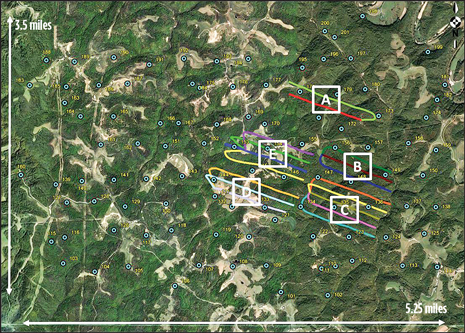
As illustrated in a recent integrated analysis of hydraulic fracturing treatments in the Marcellus shale, in these highly complex fracture networks, accurate imaging is a prerequisite to understanding the response of the formation to the treatment and, thus, the effect of the treatment on production. The Marcellus evaluation comprised monitoring by a permanently installed array of buried geophones, designed to investigate the relationship between reservoir geology, wellbore completion, stimulation design and microseismic data, Fig. 1.
 |
| Fig. 1. Map view of surface microseismic monitoring array, with turquoise circles depicting recording stations, and wellpads identified with letters. |
|
Available data from well logs and cores, information on reservoir properties, regional and local geology, other subsurface structural information, and other sources, were utilized to determine how factors related to the specific Marcellus geology, and to the variability of hydraulic fracture treatments, impacted the microseismic response of the formation.1,2,3,4
A discrete fracture network (DFN) model, constructed from the fracture orientations defined by failure planes from source mechanisms, was used as the basis for exploring well treatment parameters. Five well treatment attributes, including flowrate, treatment pressure, stage duration, stage length, number of perforations, and perforation cluster spacing, were varied to investigate the optimum range for each factor. Of the treatment parameters examined, the microseismic evaluation concluded that increasing the stage length to eliminate only one fracturing stage per well showed the highest potential to reduce treatment costs.
MARCELLUS GEOLOGICAL FRAMEWORK
The middle Devonian Marcellus shale covers more than 34 million acres in the states of New York, Pennsylvania, Ohio and West Virginia.5 The Marcellus shale is the lower unit of the Hamilton Group and can be divided into two members: the Upper Marcellus, or Oatka Creek, and the Lower Marcellus, or Union Spring, which contains more than 10% total organic content (TOC). The inorganic Mahantango or Skaneateles shale overlies the Marcellus, which conformably overlies the Onesquethaw Group, which consists of limestone, chert and inorganic shale, including the Onondaga limestone.
As the Marcellus shale is laterally widespread throughout the Appalachian basin, variances in thickness, thermal maturity and pressure are common. Typically, the Marcellus thickness ranges from 10 ft in Ohio to more than 250 ft in Pennsylvania and New York. Wells targeting the Marcellus are drilled to more than 5,000 ft, though Ohio wells are shallower. Thermal maturity increases from west to east across the Appalachian basin.6 Operators report normal-to-above-normal pressure in the Marcellus shale across the basin. However, below-normal pressures have been reported in West Virginia, leading to alternative treatment parameters. As with all unconventional reservoirs, production of the Marcellus is directly related to the presence of natural fractures and the ability to stimulate those fractures during treatment.
Two fracture sets are present in the Marcellus shale, with the J1 fractures oriented northeast to southwest and formed as natural hydraulic fractures during the Alleghenian Orogeny. These fractures are parallel to the current, maximum, horizontal stress orientation in the Appalachian basin. The J2 fractures, oriented northwest to southeast, were formed during hydrocarbon generation, and cross-cut the older J1 fracture set.
Both J1 and J2 fracture sets are natural hydraulic fractures and have very similar apertures and surface roughness. However, owing to the presence of methane that inhibits precipitation in the fractures, the J1 group lacks cement or mineralization. The J1 fracture set is more prevalent and closely spaced than its J2 counterpart, which, combined with the lack of cement, yields a higher permeability.7,8.9
Ideally, the J1 fracture set should be activated pre-production to exploit its high permeability, after which the J2 fracture set should be activated to connect the parallel J1 fractures. If the J2 fracture sets are stimulated, those fractures inevitably will intersect the J1 set, thus allowing simultaneous production from those fractures. Marcellus operators have found that well azimuths at a high angle to SHmax activate both the J1 and J2 fracture sets and yield the highest production.
INTEGRATED MICROSEISMIC STUDY
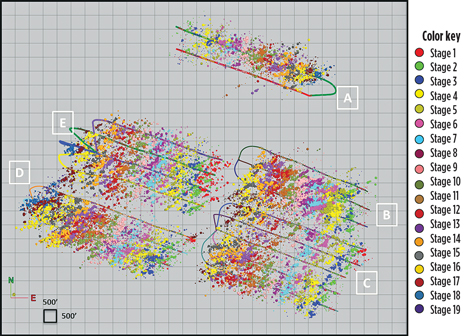
A recent study showcases an integrated analysis of microseismic data acquired during the aggregate hydraulic fracturing treatment of five well pads. The microseismic response of the formation to the hydraulic stimulation of the pads showed considerable variation, Fig. 2. The observed variability in the microseismic response, under the footprint of the array, was used to derive and extrapolate regional trends to optimize field development. The initial production was compared to reservoir and engineering parameters, such as treatment pressures, sequence of treatments (toe-to-heel vs. zipper-frac), net pressures, and stage spacing, to determine if the variability in the microseismic results is due to engineering differences or spatially-varying reservoir properties.
 |
| Fig. 2. Map view of microseismic events for Marcellus case study, with events colored by stage and sized by energy. |
|
The microseismic data set examined in the investigation was acquired with a permanently installed, near-surface array of 101 geophone stations. To ensure optimal coupling with the earth, the geophones were cemented in place in purpose-drilled shallow boreholes. Similar in principal to a dish microphone, surface microseismic monitoring utilizes full-waveform stacking to determine microseismic hypocenters. The array of geophones, representing the dish, can be computationally pointed at target locations, which is referred to as beamsteering, a type of migration commonly used in conventional seismic imaging. The wide azimuth, large aperture, and high-fold geometry allow for a consistent resolution under the entire footprint of the array, which in this case, comprises an area of just over 18 sq mi.
Stacking hundreds to thousands of seismic traces enhances the signal-to-noise ratio, allowing for an accurate estimate of the hypocenter location. The wide-azimuth, large-aperture sampling of the seismic wavefront provides a high-confidence estimate of event magnitude, as well as the failure mechanism for every event.
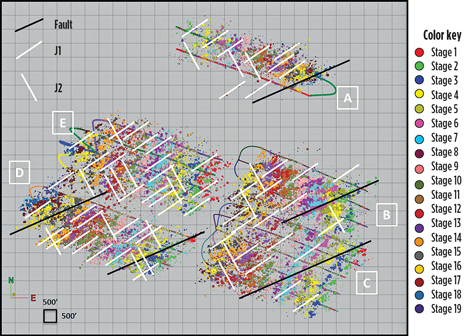
The microseismic response of the formation to the hydraulic stimulation of the five wellpads showed considerable variation. Here, pronounced linear features can be observed in both the J1 and J2 direction (Fig. 3), as well as larger linear structures extending over multiple wellbores at a slightly different azimuth, interpreted to be faults. Considering the regional geology and Marcellus-specific features, the recorded microseismic activity can be closely linked to the reactivation of natural fractures.
 |
| Fig. 3. Microseismic events observed in the Marcellus case study, and colored individually by stage and sized by energy. Fault, J1 and J2 features are visible in the data, and illustrated by lines with respective color and orientation. |
|
Because of the geometry of the monitoring array, the seismic wavefront arriving at the receivers can be inverted for the focal mechanism of a microseismic event. For the data set presented in this study, hundreds of source mechanisms have been picked, falling into four general groups for observation, including dip-slip, oblique dip-slip, strike-slip, and oblique strike-slip mechanisms. Focal mechanisms not only indicate the direction of movement along the failure plane, they also indicate the stress state that facilitated the failure.
Dip-slip failure occurs in a normal faulting regime, in which the overburden stress is the maximum principal stress, the maximum horizontal stress is the intermediate principal stress, and the minimum horizontal stress is the minimum principal stress. In a strike-slip faulting regime on the other hand, the maximum horizontal stress is the maximum principal stress, the vertical stress is the intermediate principal stress, and the minimum horizontal stress remains the least principal stress.
From the large population of focal mechanisms, the magnitudes and directions of the three principal stresses can be inverted. As dip-slip and strike-slip events are an indication of different stress regimes, the stress inversion was performed separately on these two groups of events. For every mechanism group, the direction of maximum horizontal stress, as well as a stress ratio relating the three principal stresses to each other, was calculated. The minimum horizontal stress was estimated from closure pressure analysis with treatment pressure data. Converting surface data to bottomhole data by accounting for rate-dependent friction pressure, closure pressure was determined for 25 stages, with an overall average of 6,618 psi. Vertical stress was estimated at 7,090 psi by integrating a density log for an offset well under the array, to the average target depth of all the pads.
Evaluating the occurrence of events in time, with respect to their distance from the wellbore, it was observed that the two mechanism groups define spatial and temporal subsets. The occurrence of dip-slip events peaks both closer to the wellbore and earlier in the stage, whereas the occurrence of strike-slip events peaks further away from the wellbore, and later on in the stage.
It is evident that a different local stress state is required for the occurrence of strike-slip events, compared to dip-slip events. While the way in which additional pressure that the reservoir is subjected to, during the injection, is largely dependent on regional geology and the tortuous flowpath through the rock, the stimulation approach also seems to have an effect. The way in which pressure in the reservoir along the wellbore is built up appears to be correlated to the occurrence of strike-slip events. Comparing conventional, toe-to-heel, one-well-at-a-time treatments to zipper-frac stimulations, the latter show almost twice as many strike-slip events. The average percentage of strike-slip events for the first case is 21%, whereas the average for zipper-fraced wellbores is 38%. A weak positive correlation is evident between the percentage of strike-slip events to production normalized by lateral length. The relevance of this becomes obvious, when examining the natural fracture reactivation visible in the data set.
Although both dip-slip and strike-slip failure occur along both joint sets, it was observed that strike-slip events tend to form lineaments in the J2 direction, substantially more pronounced than in the J1 direction; dip-slip events showed the opposite behavior. More strike-slip failure might, therefore, be an indication of increased J2 reactivation. Since two joint sets are found in the Marcellus, it might be beneficial for a stimulation treatment to reactivate both, to increase the complexity of the fracture network and subsequently enhance the overall permeability.
DFN MODEL
The DFN model was generated using the microseismicity data, as well as outcrop information on Marcellus natural fractures, which represented the unstimulated background network in the reservoir. The orientation of the fracture failure plane was defined using data from the source mechanisms with a statistic scatter applied to it, where the orientation maximum is centered on the focal mechanisms failure plane.
A DFN-based hydraulic fracture simulation program was used to model the injection-induced reactivation of natural fractures in the DFN. Using the stress parameters obtained from the treatment pressure analysis and the stress inversion, a series of simulations based on the Mohr-Coulomb criterion for determining where stress conditions meet, and cause slip, on the fracture face, were run to calculate where failure might occur on fractures in the model. A base case model was created that matched the observed reactivation of natural fractures seen in the microseismicity by adjusting certain input values within a reasonable range. The growth extending from the wellbore follows the J1 fractures, roughly parallel to the direction of maximum horizontal stress, with the J2 joints connecting the longer J1 trends to each other.
The in-situ stress state that was determined to be present at the beginning of the treatment was used in the model as a static condition; the maximum principal stress is vertical. While the microseismic data also show the presence of a strike-slip faulting regime on a very local scale, the modeled reactivation of both joint sets, for the base case model, suggests that the fluid pressure increase during the treatment is high enough to already cause failure along joints that strike at a very high angle to the maximum horizontal stress, for the normal faulting regime.
TREATMENT OPTIMIZATION
Using the base model DFN, the team explored the effects of changes in treatment parameters on the resulting fracture network for three consecutive stages on one of the wellbores included in the study. The ultimate aim was to refine completion designs for optimal economic return. Thus, five treatment attributes were selected, after which the DFN model was re-run with a single attribute varied for each run.
FLOWRATE
The flowrate of the treatment fluid was allowed to vary ±30% from the base model. The lower flowrate DFN model returns a much smaller fracture network, due to the lower volume of fluid injected and the lower energy content of the injection associated with the lower flowrate. When the flowrate was increased, the model developed an area of aggressive fracturing and a less complex fracture network than the base model. The greater momentum of the fluid, which is associated with an increased pump rate, can make it more difficult for the fluid to turn corners. Fractures in the increased flowrate model align strongly with SHmax.
PRESSURE
As the injection pressure is an indication of the ease with which the reservoir takes fluid, the treatment pressure in the model was varied, up to 30%. A lower treatment pressure represents a condition, where the fluid can flow more easily around the tortuous reservoir. Therefore, the lower pressure model shows fluid following paths of least resistance. Natural fractures and thief zones allow fluids to flow far afield, without creating additional permeability.
Conversely, the increased pressure model indicates greater resistance to injection, which is a function of the rock properties incorporated into the model. The results do not seem to represent a real case, where increased pressure is tied to higher fluid flowrate. Accordingly, this would indicate that the idea of establishing pressure as the only variable in the model is inaccurate. Pressure change is intrinsically tied to flowrate and cannot be accurately modeled separately.
DURATION
The duration of treatment was allowed to vary by ±30%. Increasing the duration of the treatment also means increasing the volume of fluid, while maintaining the flowrate at the base case level. When duration was decreased, the fracture network model, as expected, was diminished. The opposite is true for increasing treatment duration. Microseismic evidence, therefore, suggests there is a point of diminishing returns in stage treatment duration. The outside edge of the treatment fluid continues to expand into the reservoir, decreasing pressure per square inch as it grows. When the fracture network is too large at the outer edge, the pressure at the fracture tips is insufficient to continue fracture propagation.
STAGE LENGTH
Stage length was varied by ±20 ft for the reduced and increased models, while maintaining the distance between stages, Fig. 4. The resulting difference between the reduced stage length case, and the extended stage length case, is not significant enough to establish a marked difference within the modeling software. It was expected that longer stages reduce cluster density, showing less interference between the fractures growing from each cluster. Closer cluster spacing, with a highly dense natural fracture network, as is present in the Marcellus, is expected to create a more complex network. If an increased stage length produced a sufficiently complex fracture network, one stage over the length of the wellbore could be eliminated, resulting in substantial savings per wellpad.
 |
| Fig. 4. DFN model with decreased (left) and increased (right) stage length, with the contiguous lines representing the wellbores. The microseismic data are shown as colored dots. Fracture planes are shown in green. |
|
NUMBER OF PERFORATIONS
The number of perforations was varied by one extra perforation, holding the perforation interval fixed, Fig. 5. The models run showed that increasing the number of perforations causes overlap and interference of the stimulated fracture zones. In a reservoir like the Marcellus, where the natural fracture network is already dense, the increased number of perforations, likewise, increased reactivation of the J1 and J2 joints, creating a more interlinked fracture network than the base model. The Marcellus study revealed that decreasing the number of perforations results in less reactivation of natural fractures, with the DNF model showing a less desirable outcome than the base model.
 |
| Fig. 5. DFN modeled with fewer (left) and more (right) perforations. The contiguous lines represent the wellbores; the microseismic data are shown as colored dots. Fracture planes are shown in green. |
|
OPTIMAL RANGE
By varying the five well treatment parameters used in the calibrated DFN model, the integrated Marcellus stimulation investigation effectively determined the optimal range for each factor to help maximize production. The increased flowrate model showed better results than those delivered from the reduced-rate model. Given the possibility of over-stimulation, and considering the wellbore spacing in the study, the increased flowrate model is not sufficiently clear to make a definitive recommendation. Further, an increased flowrate could require additional operational requirements, such as higher hydraulic horsepower, which together with the higher cost of pumping and more material, may not yield sufficient improvement to make it an economically feasible option.
Moreover, while the lower pressure model showed better results, the modeled treatment pressure was not tied to a flowrate that can be realized. Consequently, no recommendation on the benefits of lower and higher pressures can be made based, on these results.
Also, the longer-duration treatment model outperformed the short-duration model. Given the wellbore spacing of the modeled location, longer duration leads to overstimulation, such as excessive overlap onto the neighboring wellbores. The economic trade-off depends on the well spacing of a planned field versus the expense of pumping resources.
Meanwhile, increasing the number of perforations resulted in a better fracture network model, but compared to the base case, the improvement is minor and might not warrant the cost of an additional perforation cluster. The operational costs associated with an additional perforation cluster probably would not justify the expense.
Theoretically, of all varied completion parameters examined, increasing the stage length poses the highest potential for cost savings. Increasing or decreasing the stage by 20 ft was chosen, as it would result in either saving one stage or adding one over the total length of the wellbore.
Given the natural fracture density observed in outcrops of the Marcellus shale, eliminating one stage to add 5 ft between each of the five perforation clusters should only minutely change the hydraulic fracture network. As J1 fractures are so dense and closely spaced, eliminating one stage would pose a negligible change to the fracture network, but would, conceivably, reduce both the costs and environmental footprint of the treatment. If one hydraulic fracturing stage per well could be eliminated, the potential savings for a multi-well drilling pad can approach seven figures. Unfortunately, however, the model results were not sufficiently conclusive enough to make a strong recommendation.
Further studies should be conducted, using a more sophisticated model, where attributes are fully dependent on each other. Increasing treatment pressure, for example, should be coupled with a change in flowrate. Additionally, even though it has been shown that the observed microseismic activity is related to the reactivation of natural fractures, future modeling efforts should place some emphasis on the induced hydraulic fracture. 
ACKNOWLEDGMENT
This article was adapted from SPE paper 164807, “Hydrocarbon production and microseismic monitoring —treatment optimization in the Marcellus shale,” presented at the 2013 EAGE annual conference and exhibition, London, June 10-13.
REFERENCES
1. Duncan P. M. and S. Williams-Stroud, “Marcellus microseismic,” Oil and Gas Investor, Vol. 10, pp. 65–67, November 2009.
2. Neuhaus C. W., S. Williams-Stroud, C. Remington, W. B. Barker, K. Blair, G. Neshyba and T. McCay, “Integrated Microseismic Monitoring for Field Optimization in the Marcellus Shale,” SPE paper 161965, SPE Canadian Unconventional Resources Conference, Calgary, 30 Oct.–1 Nov., 2012.
3. Neuhaus, Carl W., C. Telker and M. Ellison, and K. Blair, “Hydrocarbon production and microseismic monitoring – treatment optimization in the Marcellus shale,” SPE paper 164807, presented at 2013 EAGE annual conference and exhibition, London, June 10–13, 2013.
4. Williams-Stroud, S., C. W. Neuhaus, C. Telker, C. Remington, W. B. Barker, G. Neshyba and K. Blair, “Temporal evolution of stress states from hydraulic fracturing source mechanisms in the Marcellus shale,” SPE paper 162786, presented at 2012 SPE Canadian Unconventional Resources Conference, Calgary, Oct. 30–Nov. 1, 2012.
5. Engelder, T., G. G. Lash and R. S. Uzcategui, “Joint sets that enhance production from Middle and Devonian gas shales of the Appalachian basin,” AAPG Bulletin, Vol. 93, pp. 857–889, July 2009.
6. Wrightstone, G., “Marcellus shale—geologic controls on production,” Search and Discovery Article #10206, AAPG annual convention, Denver, June 7–10, 2009.
7. Kranz, R.L., A. D. Frankel, T. Engelder and C. H. Scholz, “Permeability of whole and jointed Barre granite,” International Journal of Rock Mechanics and Mining Sciences and Geomechanics, Abstracts, Vol. 16, pp. 225–234, 1979.
8. Lash, G.S., S. Loewy and T. Engelder, “Preferential jointing of Upper Devonian black shale, Appalachian plateau, U.S.A.: Evidence supporting hydrocarbon generation as a joint-driving mechanism,” Geological Society Special Publications, 231, pp. 129–151, 2004.
9. Loewy, S.L., “The post-Alleghenian tectonic history of the Appalachian basin based on joint patterns in Devonian black shales,” MS thesis, Pennsylvania State University, University Park, Pa., p. 179.
|
The authors
CARL NEUHAUS is Completions Evaluation Team Leader for MicroSeismic, Inc., responsible for the engineering applications and integration of engineering data with geology, geophysics and geomechanics. Mr. Neuhaus earned an MS degree in petroleum engineering with drilling and completions focus from Mining University of Leoben. He also holds an MS degree in petroleum engineering with hydraulic fracturing focus from Colorado School of Mines.
CHERIE TELKER is Geology Team Leader at MicroSeismic, Inc. As head of the Geology department, Ms. Telker personally oversees the quality of each project from her team, in addition to her own work modeling discrete fracture networks from microseismic results. Ms. Telker earned a BA from University of Missouri in Columbia, Missouri, and a MS in Geology from Missouri University of Science and Technology in Rolla, Missouri. She is a member of American Association of Petroleum Geologists (AAPG) and has co-authored several technical papers.
MARY ELLISON is Geologist II at MicroSeismic, Inc. As a member of the geology team she uses microseismic data from hydraulic fracture treatments to produce Discrete Fracture Networks and calculate Stimulated Rock Volume. Ms. Ellison earned a BS degree from Boston University and an MS degree from the University of New Orleans.
KEITH BLAIR is Vice President and Exploration Manager for Gastar Exploration Ltd. Mr. Blair has over 30 years of natural gas and oil experience and has gained extensive working knowledge of natural gas and oil basins in Colorado, New Mexico, East Texas, West Virginia/Pennsylvania, offshore Gulf of Mexico and the Texas/Louisiana Gulf Coast. He graduated from Texas A&M University with a BS degree in geology.
|
|


