SCOT MCNEILL, DANIEL KLUK, PUNEET AGARWAL and KENNETH BHALLA, Stress Engineering Services Inc.; and TOMOZAKU SARUHASHI, IKUO SAWADA, MASANORI KYO, EIGO MIYAZAKI and YASUYUKI YAMAZAKI, Japan Agency for Marine-Earth Science and Technology (JAMSTEC)
The increasing demand for energy has driven offshore oil and gas exploration and production (E&P) into regions that place onerous demands on structures and equipment. Physical demands, such as pressure, temperature, water depth, wave and current loading, and corrosion potential, lead to arduous engineering challenges. Each demand carries with it uncertainty that must be covered by adequate safety margins. When coupled with stricter safety and environmental standards, uncertainty may render E&P projects cost-inefficient, if not impractical.
Among the various initiatives that may be employed to combat uncertainty is enhanced data acquisition and utilization. In this application, high-fidelity data are collected in-situ and utilized to garner valuable new information, reducing uncertainty. Such information may be applied immediately to assist E&P activities, as well as be incorporated into general scientific knowledge. This results in more capable equipment designs, and more accurate analysis and simulation techniques. Despite the copious uses and benefits of measured data, in-service data acquisition and utilization for structural monitoring has been slow to catch on in the industry, for numerous, varied reasons.
This tendency may be countered by implementing a holistic approach to structural integrity management. Such an approach will be adopted first by those that are pushing the envelope in regions, where demands on structures and equipment necessitate a significant change in operations. One scientific drilling company, the Center for Deep Earth Exploration (CDEX) within the Japanese Agency for Marine-Earth Science and Technology (JAMSTEC), has already taken the initiative to employ a real-time riser monitoring program. JAMSTEC/CDEX has developed and deployed many new technologies to accomplish its drilling objectives. Similar to oil and gas drilling companies, CDEX’s drilling operation is influenced by cost, schedule and other economic constraints. However, the company has always had a symbiotic relationship with data collection technologies that help to advance its objectives. Perhaps, this is because the advancement of seismic science and technology, an instrumentation-and-data-intensive pursuit, is the company's primary aim.
In this article, we highlight one such technology that expands drilling operational envelopes, extends riser fatigue life, enhances safety, and has the potential to improve design and predictive analysis capabilities—the Riser Fatigue Monitoring System (RFMS). The RFMS, developed by Stress Engineering Services, Inc., for CDEX, utilizes accurate and robust vibration monitoring instrumentation at strategic locations, along with information from an analytical Finite Element (FE) model to provide real-time stress and fatigue damage over the entire riser system. And since the only required online inputs are the dynamic riser response, top tension and mud weight, fatigue estimates may be calculated without knowing impinging currents, wave conditions or other sources of excitation (although fatigue response may be correlated to these data, if available).
An unprecedented level of information, regarding the riser’s health, is provided to the crew through the RFMS. Engineers receive real-time data on vibration levels, stress levels, excited modes and frequencies, and fatigue damage. Riser responses to changes in top tension and mudweight can be observed in detail shortly after they are made.
The RFMS was installed during two drilling campaigns aboard the Chikyu scientific drilling vessel. These campaigns occurred at the Shimokita site (1,180-m water depth) and the Nankai trough site (1,939-m water depth). Current speeds of up to 5.3 knots were encountered at the latter site, with sustained currents over 4 knots. The system architecture is presented in the next section, including descriptions of the hardware and software. Sample data and results from the two aforementioned drilling campaigns are provided in the following section.
ARCHITECTURE OF THE RFMS
The primary motivation for the RFMS is monitoring riser fatigue damage, due to vortex induced vibrations (VIV). These can occur while drilling off the coast of Japan, due to the high-speed Kuroshio (black water) current. The system is equally capable of tracking damage, due to wave loading and other sources of vibration. The RFMS was designed for drilling in the Nankai Trough, off the coast of Japan, with a depth of 1,939 m. Many scientific drilling campaigns are being conducted in this region by CDEX, using the Chikyu as part of the Nankai Trough Seismogenic Zone Experiment (NanTroSEIZE).
A fundamental design driver for the RFMS is the need to acquire accurate, synchronous dynamic measurements in a subsea environment, with reliability. Another important requirement is to minimize the impact of the system’s deployment on normal riser running operations, driving a need for easy installation and retrieval in minimal time. Objectives for the system were outlined early in the project, as follows:
- Produce high-quality, time-synchronized measurements of riser response in five degrees of freedom (one axial and two lateral translations, and two lateral rotations) at several discrete subsea vibration data logger (SVDL) installation points along the riser length.
- Display real-time frequency and time measurements.
- Display fatigue damage rate and cumulative damage estimates at any elevation and angle around the riser circumference, along with intermediate results (excited modes, modal contribution to vibration, etc.) at 15-min. intervals.
- Track the accumulated fatigue damage on a per-joint basis, to aid in joint rotation and inspection schedules.
- Minimize the number of SVDL installations on the riser, to reduce the impact on riser running operations.
- Incorporate redundancy and maximize reliability.
To meet these criteria, SES chose high-resolution, low-power accelerometers and angular rate sensors to record the riser’s dynamic response. Though such vibration sensors do not provide direct measurement of stress and fatigue, as do foil or fiber-optic strain gages, they have a number of advantages over strain gages in a subsea drilling environment, including:
- Only a rigid connection to the drilling riser is required for accurate dynamic measurements. No welding, bonding, embedding or other special surface preparation of the riser joints is necessary. It may also be necessary to compromise the protective coatings on the riser, to bond strain gages to the steel substrate, which may result in corrosion.
- Accelerometers and angular rate sensors may be housed entirely within a one-atmosphere subsea enclosure, thereby preventing damage from the ocean environment. Because they are bonded to the structure, encapsulation of strain gages (or their connections) is still more difficult, rendering strain gages susceptible to seawater damage.
- The housings containing the accelerometers and angular rate sensors are installed easily during riser running (and removed during retrieval) simply by bolting, thereby preventing damage during handling operations. Furthermore, the system may be reconfigured for a new riser string, simply by changing the sensor and clamping hardware locations. Conversely, strain gages must remain attached to their riser joints, making them susceptible to handling damage.
An enabling technology for the RFMS system is the enhanced Modal Decomposition and Reconstruction (MDR) method.1 The enhanced MDR algorithm reconstructs complex vibration response at any location on a structure from a set of spatially sparse measurements. In the riser application, stress time histories are reconstructed at numerous locations on the riser system from the measured acceleration and angular rate data at (typically) 5–10 locations on the riser. Fatigue damage is then computed, using standard rainflow cycle counting and S-N methods.
The instrumentation system hardware, depicted schematically in Fig. 1, consists primarily of (typically) 5–10 SVDL “bottles,” an armored subsea cable containing optical fibers and copper wires, and a topside Data Acquisition and Processing Unit (DAPU). The DAPU is comprised of a rack housing the server, controllers, transceiver boards, Ethernet switches, power conditioning and UPS, etc. A remote desktop human-machine interface (HMI) is provided to allow user access and control of the system from the company office aboard the Chikyu.
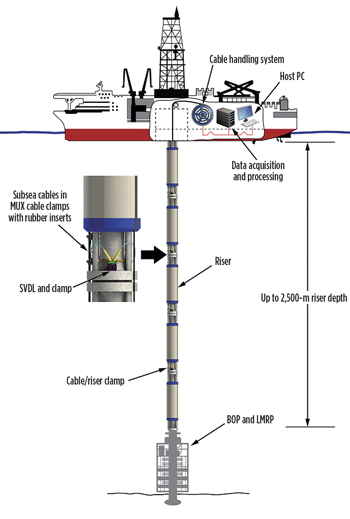 |
| Fig. 1. RFMS instrumentation and data acquisition system schematic. |
Figure 2 shows the SVDL bottle components (left) and cable connectors (right). The system was designed to perform the following functions within each SVDL: measure vibration data, using an accelerometer and angular rate sensor; low-pass filtering of the data; digitizing and recording the data. Note that the data are digitized within the stainless steel SVDL pressure housing to reduce the potential for external electrical noise to corrupt the signal, prior to digitization. Digital data are then transmitted to the topside unit through the optical fibers to the topside DAPU, where data from each SVDL are synchronized and combined. A GPS clock serves as the master system timekeeper. Periodically, the internal SVDL clocks are synchronized to the GPS clock.
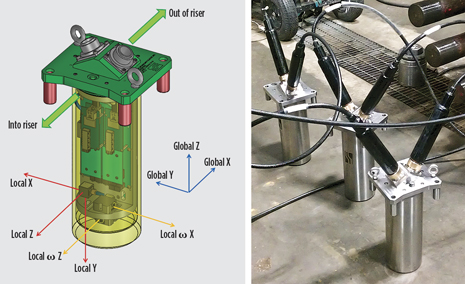 |
| Fig. 2. SVDL interior arrangement (left) and physical units with cables during testing (right). |
RFMS hardware is designed to enhance reliability. For example, network architecture has independent, primary, fiber optic links to each SVDL measurement module. A primary fiber optic transceiver failure in one SVDL will not affect other modules, nor will a primary fiber failure in the cable. In addition, a backup fiber optic link, in a daisy-chain configuration, provides redundancy during a primary link failure. Power redundancy is also provided via independent supply circuits and uninterruptable power topside, independent supply conductors in the cable, and redundant conditioning circuitry in the SVDLs.
HIGHTLIGHTS FROM DEPLOYMENTS
Shimokita site. The Deep Coalbead Biosphere drilling campaign occurred in late-summer 2012, off the coast of the Shimokita Peninsula in the northern part of Honshu Island, Japan.2 The system was deployed for the first time at the Shimokita site for testing and shakedown, in a relatively benign current environment. Owing to the water depth being shallower than the depth at NT3-01 (1,180 vs. 1,939 m), only four SVDLs were deployed.
We began measuring the riser system just prior to landing the BOP on the wellhead. We logged continuously throughout the six-week drilling campaign at Shimokita. Figure 3 shows normalized fatigue damage results from the Shimokita site. The left window shows fatigue damage rate (top) and running cumulative fatigue damage (bottom) at desired locations in the riser. Only the location with the highest fatigue damage is shown. Damage at other locations can be investigated, using controls on the right side of the window. Although strong VIV did not occur during deployment, fatigue damage rates changed significantly, due to varying current and wave conditions.
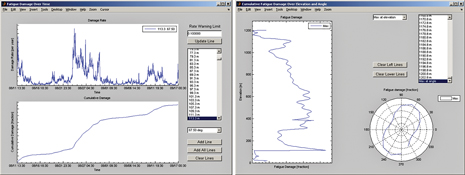 |
| Fig. 3. Normalized fatigue damage output displayed over time (left) and over the riser elevation (right) for Shimokita deployment. |
A plot of normalized cumulative damage over riser elevation and angle are shown for the Shimokita deployment in the right window of Fig. 3. By default, the maximum fatigue damage over all angles is shown at each elevation in the plot. Damage over specific angles can be added to the plot. Discontinuities in the damage occur, where changes in the fatigue curve or cross-sectional properties take place. Similarly, the maximum fatigue damage over all elevations is shown at each angle in the lower-right plot. Damage at specific elevations can be added to the plot.
The two figures contain cumulative information on riser fatigue. Similar but simplified figures are available for maximum fatigue in each riser joint, but are omitted here for brevity. The remaining figures for the Shimokita deployment contain individual short-time information. Figure 4 illustrates an Acceleration Results Window during a 1-hr time period, when several modes are clearly excited, simultaneously. Time history traces are shown in the upper plot, while Power Spectral Density (PSD) curves are shown in the lower plot. By default, the average PSDs for the X and Y directions are shown. Additional channels may be viewed, using controls on the upper right of the GUI. Spectral peaks are depicted as stars in the plot. The first seven modes are clearly excited, as a spectral peak is observed for each in the 0–0.12 Hz range.
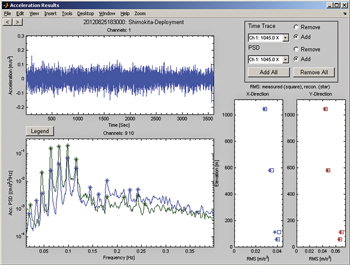 |
| Fig. 4. Sample acceleration results window for Shimokita deployment. |
Further results are displayed for each spectral band surrounding a single spectral peak in the X and Y direction PSD plots. Information about each empirical (measured) excited mode, extracted from the vibration data, and corresponding analytical excited mode can be obtained by clicking on the stars. This information is illustrated in a separate window. Results for excited modes 2 and 5 are shown in Fig. 5, top and bottom, respectively. The windows contain the empirical mode shape (left plot, red stars), corresponding analytical mode shape (left plot, blue line and stars), strength of the participating modes in the corresponding spectral band (right plot), and measured and reconstructed RMS acceleration comparison for the spectral band (middle plot). In Fig. 4, the two plots on the lower right present measured and reconstructed acceleration RMS values for the X and Y direction vibrations over the entire bandwidth of interest. The software is doing a good job reconstructing the vibration response in each spectral band, as well as the entire bandwidth of interest. Other information, such as the empirical frequency, analytical natural frequency, measured mode shape complexity, empirical/analytical frequency error, and the degree of empirical/analytical mode shape correlation is listed in the upper part of the GUI windows of Fig. 5.
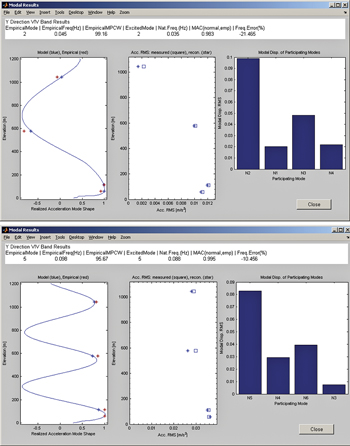 |
| Fig. 5. Sample modal results window for Shimokita deployment – mode 2 (top), mode 5 (bottom). |
Nankai NT3-01 site. After completing the Shimokita campaign, the RFMS was retrieved with the riser and prepared for the NanTroSEIZE – Stage 3 drilling campaign at the NT3-01 site, in the Nankai Trough.3 The deployment commenced in early October 2012 but was quickly suspended, due to typhoons. The deployment was resumed in late October 2012. Seven SVDLs were deployed along the 1,900-m riser length. Additionally, fairings were installed on 300 m of the upper portion of the riser, for VIV suppression. The drilling campaign was suspended in late November, due to rough weather. There are plans to resume drilling operations at the NT3-01 site later in 2013. The RFMS will be redeployed with the drilling riser.
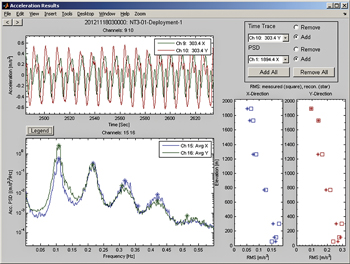 |
| Fig. 6. Sample acceleration results window for NT3-01 deployment (disconnected riser). |
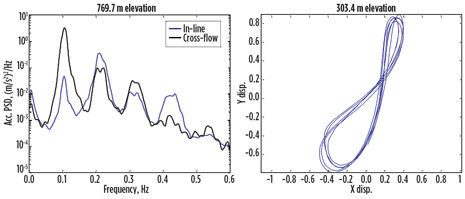 |
| Fig. 7. PSD of rotated SVDL data at 770 m elevation (left); normalized displacement at 303 m elevation. |
During the deployment period, the maximum recorded surface current speed was 5.3 knots. Additionally, current speeds over 4.0 knots were consistently recorded during the week-long period from Nov. 5 through Nov. 12, and over 3.0 knots, over roughly half of the overall deployment. These current speeds excite VIV in a riser of Chikyu’s size when fairings are not installed. However, fatigue damage calculated by the RFMS was very low (below 1% of total life), indicating that VIV was sufficiently suppressed by the fairings while the riser was connected.
Here, we examine some intermediate results during a period when the riser was disconnected, and the vessel was leaving the high-current area. Figure 6, illustrates an acceleration results window during a 1-hr period when VIV was active, as the vessel was in transit. Looking at the time series and spectra, signs of VIV are evident. The fundamental cross-flow shedding frequency is evident at 0.11 Hz. The cross-flow third harmonic is evident at 0.32 Hz. The fundamental in-line shedding frequency is evident as the 0.22 Hz (double the fundamental cross-flow frequency). The in-line harmonic is evident at 0.42 Hz. Directionality is more evident when data are rotated into in-line and cross-flow components as in Fig 7. (left). Figure 7 (right) shows SVDL acceleration data integrated to yield displacements, after removing the gravity (g*sin(θ)) component. A figure eight pattern is observable. The contribution of fundamental and harmonic components is shown in the left two plots in Fig 8. Clearly harmonic components add to RMS stresses.
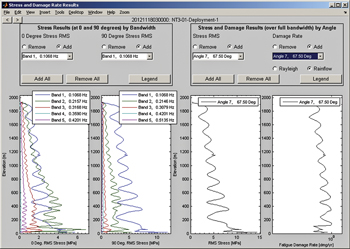 |
| Fig. 8. Sample stress and damage rate results window for NT3-01 deployment (disconnected riser). |
CONCLUSIONS
A Riser Fatigue Monitoring System (RFMS) has been developed to provide field measurements of riser stress and fatigue in near-real time. The RFMS calculates stress and fatigue at any location in a riser system via measurements from accelerometers and angular rate sensors, placed at strategic locations along the riser, along with analytical riser mode shape information. Since the only required online inputs are the dynamic riser response, top tension and mud weight, fatigue estimates may be calculated without knowledge of currents or other forcing events.
During two deployments on the Chikyu drilling riser, the system successfully recorded a number of riser excitation events (and attending fatigue damage) due to operations, weather, and VIV while connected to and disconnected from the wellhead. Vibration, stress and fatigue damage were monitored in real time.
Information provided by the RFMS will prove more useful as riser design boundaries are extended, and as structural integrity management becomes a preeminent concern in deepwater drilling and production. Ultimately, quality field data are expected to lead to improved model validation and simulation, and more focused inspection and integrity management. 
REFERENCES
1. McNeill, S. I., and P. Agarwal, “Efficient modal decomposition and reconstruction of riser response due to VIV, Proceedings of the 30th OMAE conference, Rotterdam, The Netherlands, OMAE2011-49469, 2010.
2. JAMSTEC, Deep Coalbed Biosphere Exp. 337, http://www.jamstec.go.jp/chikyu/exp337/e/, accessed December 2012.
3. JAMSTEC, NatTroSEIZE Exp. 338, http://www.jamstec.go.jp/chikyu/eng/Expedition/NantroSEIZE/exp338.html, accessed December 2012.
|


