KURT ABRAHAM, Executive Editor, and MAURO NOGARIN, Contributing Editor, Latin America
 |
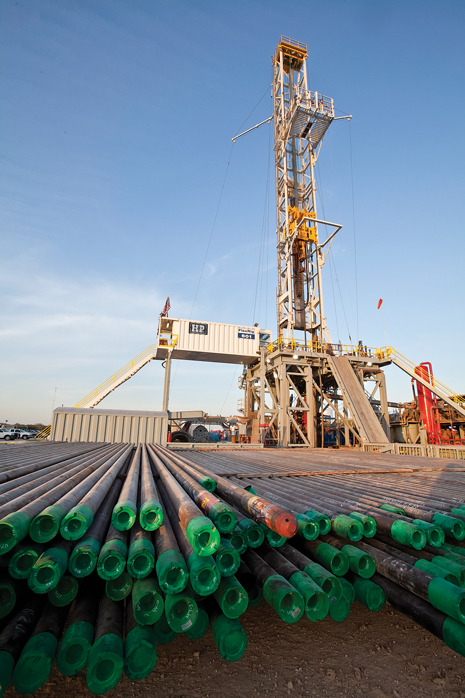
| Statoil has taken over operation of the eastern half of its Eagle Ford acreage. Photo by Mieko Mahi, courtesy of Statoil. |
|
Although oil prices are higher than they were a year ago, there has not been a stampede of operators to drill extra wells in the U.S. Part of the reason for this is a continuing problem with infrastructure being swamped in key plays, particularly liquids-oriented shales. Furthermore, given a relatively weak national economy, operators are being careful not to over-drill.
Yet, as prices approach $100/bbl in recent weeks, there may be a temptation among smaller independents to drill a few extra wells, to take advantage of high prices. Producers in the U.S. continue to be concerned about regulatory uncertainty in Washington, D.C., as well as some state capitals. In addition, there are questions about how soon, and on what scale, natural gas exports in the form of LNG might begin to take place. President Obama’s refusal to approve construction of the Keystone XL Pipeline is also hampering the movement of growing supplies of crude in the U.S.
Accordingly, the ceiling on E&P activity remains, as the number of wells drilled continues to be unable to reach the 45,000-per-year mark and beyond. Yet, U.S. oil production is running 15% to 20% above 2012 levels, exceeding 7.2 MMbpd.
For the balance of 2013, World Oil’s forecast includes these highlights:
- U.S. drilling will rise 9.5%, from 20,992 wells in first-half 2013 to 22,988 in the second half
- On a year-to-year basis, U.S. drilling will decline 3.8% to 43,980 wells in 2013, from 45,717 wells in 2012; this compares to our original 2013 forecast of 47,053 wells
- The amount of U.S. footage drilled will increase 9.1%, to 183.9 million ft of hole in second-half 2013, from 168.6 million ft in the first half. However, year-on-year, footage drilled will decline 3.0%, to 352.5 million ft. Due to more horizontal wells and greater footage per well, the annual amount of footage drilled this year is declining at a slower rate than the well count.
- The U.S. rig count during second-half 2013 may register a mild increase of 70 to 80 units
- Due to increased use of pad drilling and gains made in drilling efficiency, a smaller increase in rig count may be sufficient to satisfy a higher percentage growth in well count.
U.S. prices. Oil prices have, for the most part, remained above $90/bbl for WTI on futures markets, during the first seven months of 2013. Indeed, in recent weeks, the price has flirted with levels just above $100/bbl. This has exacerbated the flight of operator drilling capital, away from gas and toward oil. It also appears to be encouraging an increase in “discretionary” development drilling by smaller independents, looking to cash in on higher prices.
By contrast, natural gas prices have yet to recover to a level sufficient to attract operators back to gas drilling. Although gas prices have come close to $4/Mcf, they have yet to get above that level and stay there. Until that happens, there will not be a major increase in gas-directed drilling.
U.S. rig count. As of July 19, the Baker Hughes U.S. rotary rig count totaled 1,770, down 8.5% from the 1,935 figure recorded during the same week in 2012. For nearly the first seven months of 2013, the U.S. rig count averaged 1,759.9, down 10.9% from the 1,975.3 average of the same period in 2012. A hoped-for recovery in the U.S. count during the back half of 2012 never occurred. Instead, the count declined steadily, falling below 1,800 by the end of the year. We believe that this decline reflects the near-abandonment of gas-directed drilling by many operators, in favor of focusing on oil development, particularly in the shale plays.
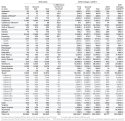
| Table 1. Mid-year revision, 2013 U.S. drilling forecast. |
|

|
Since the beginning of 2013, the U.S. count has remained in a narrow range between a low of 1,738 and a high of 1,770. Based on data supplied by state agencies and operators, we predict that there may be a mild recovery in the rig count of no more than 70 to 80 units, just enough to help achieve the drilling gain forecast for second-half 2013. Over the last 12 months, it also has become apparent that the rig count, alone, is no longer an infallible barometer of drilling activity. There are too many factors clouding the issue, including the need for fewer rigs to drill the same number of wells, due to pad drilling and other efficiency gains, along with greater numbers of horizontal wells and the ever-growing lengths of those horizontal sections.
A year ago, the oil-gas split in the Baker Hughes U.S. rig count was about 73%/27% in favor of oil. That split further widened for oil to the point that during the last two-and-a-half months, it has flirted with an 80%/20% ratio. However, it had not broken this barrier, as of the last week of July. This may still happen at some point in the next few months.
State-by-state highlights. In state after state, oil has supplanted gas as the target of choice. Although gas prices have improved moderately, it is not enough to convince operators to restore any significant share of gas-directed drilling. Meanwhile, the drilling of horizontal wells continues to increase, and the length of these sections is growing. This requires greater numbers of frac stages, and it also means that the amount of footage drilled is noticeably higher.
In Texas, activity continues to be driven by the two major drilling hubs, the Eagle Ford shale of South Texas and the Permian basin of West Texas. Encompassing part or all of Railroad Districts 1, 2 and 3, the Eagle Ford is ensuring that activity this year stays very close to the levels of 2012. Combined, these three districts will be up 3.3% during second-half 2012 at 2,208 wells, compared to the first half. However, these three districts, year-on-year, will be down slightly (-0.6%) at 4,345 wells.
 |
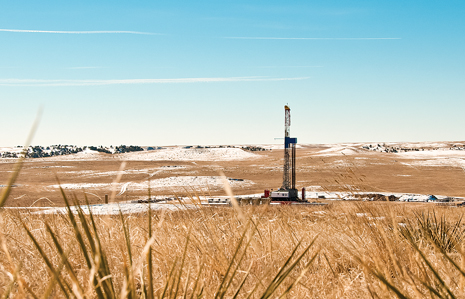
| An Anadarko Petroleum rig drills in the Wattenberg field, near Denver. |
|
In the Permian basin, which covers large portions of Districts 8, 8A and 7C, oil-directed drilling continues to dominate, with increasing numbers of horizontal wells drilled. The lengths of those horizontal wells continue to grow, as well. Nevertheless, operators have exercised some caution this year, cutting back slightly on new drilling while waiting for a backlog of completions to finish. Accordingly, their drilling in these three districts, combined, will be down 1.8% in second-half 2013 at 3,827 wells, compared to the first half. In addition, the three districts, together, will be down 6.2% at 7,719 wells versus 2012’s level. Even so, Districts 8, 8A and 7C, combined, will account for 48.6% of all Texas drilling.
On the other side of the ledger, activity remains depressed for gas-prone districts. In Districts 4 (deep South Texas, along the Gulf Coast), 5 (Barnett shale, East Texas) and 6 (East Texas), the combined second-half drilling total will be just 633 wells, down 9.3% from first-half 2013. On an annual basis, the picture is even bleaker. Together, the three districts will see just 1,331 wells combined, a 31.8% drop from 2012’s 1,951 wells.
In neighboring Oklahoma, activity remains solid and growing. Outnumbering gas-directed drilling three to one, tight oil plays in western parts of the state continue to dominate, keeping rig counts high. There will be a 7.4% increase in drilling during second-half 2013, to 1,665 wells. In addition, the year-on-year comparison shows 3,215 wells expected for 2013, up 1.7% from 2012’s figure.
In Louisiana, the Department of Natural Resources’ Office of Conservation believes that activity has stabilized. In fact, it is so stable, officials predict that second-half drilling in both the northern and southern portions of the state will equal first-half levels. In addition, the state predicts that new well drilling this year, overall, in both halves of Louisiana will virtually equal activity levels during 2012. There will be 564 wells (371 in the North, 193 in the South) in each half of the year, with 2013’s 1,128 wells barely exceeding 2012’s 1,127 wells. In the North, where natural gas once dominated, operators have made a major shift toward oil. Drilling for oil now outnumbers gas-directed wells two to one. In the South, activity is even more one-sided, with oil drilling comprising eight out of every 10 wells.
Although infrastructure in North Dakota is being stretched to capacity by the nation’s leading shale play, the Bakken, drilling will again post an increase. Compared to 2012, wells drilled will be up 6.1%, at 2,132. In addition, second-half drilling will be up 15.4%, at 1,142 wells, versus the first-half total. Keeping pace with Texas in terms of oil development, North Dakota remains the second-largest oil producer behind Texas and the federal Gulf of Mexico, producing close to 800,000 bpd.
In the Northeast, Pennsylvania is benefitting from operators’ exploitation of the wet gas window of the Marcellus shale, helping to stabilize activity that plummeted amid low gas prices. Accordingly, while activity will be down 12.6% from 2012’s level, the number of wells drilled in each half of 2013 will be equal at 1,038. In neighboring Ohio, exploitation of the oil-prone Utica shale is pushing 2013 activity considerably higher. Drilling during second-half 2013 will also be higher. In West Virginia, drilling will remain very close to the 2012 level, at 460 wells. There will also be a slight increase in the second half, as opposed to the first-half level. In what had been an almost exclusively gas-directed state, oil now comprises 30% or more of all activity.
In the Rockies, there will be second-half increases over first-half activity in Colorado, New Mexico and Utah. However, as compared to 2012 levels, drilling during all of 2013 will be down moderately in all three states. Colorado continues to be affected positively by the Niobrara shale, with a majority of wells, statewide, now targeting oil. New Mexico’s activity is being driven by drilling in the southeastern section of the state, particularly in its portion of the Permian basin. Again, oil is dominating the picture, with oil-directed drilling outnumbering gas wells about 10 to one.
 |
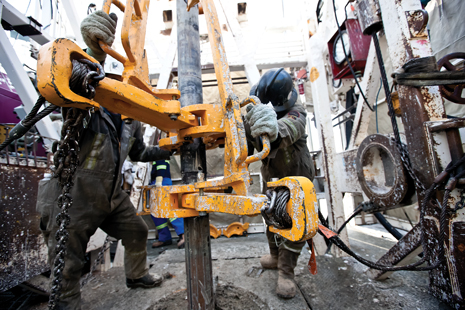
| A crew works on the drill floor of a rig in Apache Canada’s House Mountain operating area. |
|
California’s upstream sector is almost entirely oil-directed at the moment. Leading the way are the state’s two largest operators, Aera Energy and Occidental Petroleum. Along with other operators, they will push activity 28% higher during second-half 2013. In addition, compared to 2012’s level, the full-year total will be 6.3% higher. The vast majority of activity will be development wells in established fields, although a few exploratory wells may be spudded in the Monterey shale.
As concerns Alaska, activity in the Arctic offshore has come to a standstill, highlighted by Royal Dutch Shell’s decision to take a hiatus this year. In the meantime, activity remains concentrated in traditional areas, including the North Slope and Cook Inlet. The state’s Oil & Gas Conservation Commission believes that there will be a 25% gain in onshore drilling during second-half 2013. Compared to all of 2012, this year’s total well count will be up slightly.
About these statistics. World Oil’s U.S. tables are produced with the aid of data from a variety of sources, including API, the Texas Railroad Commission, other state and federal regulatory agencies, and a variety of operating companies. We thank all contributors for their time and effort in providing data and analysis.
World Oil editors try to be as objective as possible in the estimating process, to present what they believe are the most current data available. Sound forecasting can only be as reliable as the base data. In this respect, is should be noted that well counting is a dynamic process, and most historical data will be continually updated over a period of several years before “the books are closed” on any given year.
CANADA
Given the high crude price environment of the global upstream industry, Canadian producers are making money by concentrating on development of additional oil production. Yet, they are not wildly happy about their overall situation. There are concerns about how crude oil is going to be transported and moved around, if new pipeline capacity is not built quickly enough to keep up with growing supplies, including the delay of the U.S. Keystone XL Pipeline. Producers also fret about the future of gas drilling, production and exports, as they watch and wait for gas prices to recover. In summary, it will be a solid, healthy year for Canada’s upstream but not an outstanding one.
Drilling. There were 13,149 wells drilled (including eight offshore) last year, totaling 72.3 MMft of hole. Oil completions accounted for 64.1% of new wells drilled, numbering 8,432. Gas wells drilled totaled just 1,110. This year, CAPP predicts a 12.5% drop to 11,510 wells, including 10 offshore.
According to the Canadian Association of Oilwell Drilling Contractors (CAODC), the Canadian upstream industry, in line with drilling more oil wells, continues to drill complex horizontal wells and averages 11.4 days per well. Meanwhile, the National Energy Board (NEB) released its natural gas deliverability energy market assessment, indicating that Canadian natural gas producers are undertaking minimal gas drilling activity, as current prices do not cover the full costs of developing most natural gas prospects.
In its report, Short-term Canadian Natural Gas Deliverability 2013-2015, the NEB examines trends for natural gas deliverability in Canada (the ability to produce gas from new and existing wells). The three key supply and demand drivers influencing future Canadian gas deliverability include:
- Minimal drilling activity, because prices do not cover the costs of developing most natural gas prospects.
- Growth in natural gas as a by-product from developing oil- and NGL–rich prospects.
- Producers are not earning sufficient returns to attract additional equity investment with current prices at around $3/MMBtu in western Canada.
Production. Combined output of crude and condensate was up 6.8% last year, averaging 3.067 MMbpd. Within that figure, conventional production averaged 1.324 MMbpd, up 3.6% from 2011’s figure. Oil sands production was 1.743 MMbpd, a 9.3% increase over the previous year.
In its annual crude forecast released June 10, 2013, the Canadian Association of Petroleum Producers (CAPP) predicted that Canadian oil production will more than double to 6.7 MMbpd by 2030, from 3.1 MMbpd in 2012. This includes Alberta oil sands production of 5.2 million bpd by 2030, up from 1.7 million bpd in 2012. While the overall trend is similar to last year’s forecast, the notable differences include an increase in total production of 500,000 bpd by 2030, the industry group stated. The increase includes incremental conventional production of 300,000 bpd by 2030 and oil sands production of 200,000 bpd by 2030. The forecast also includes a progressive shift toward more supply from oil sands in situ output.
An Energy Resources conservation (ERCB) report indicates the largest conventional crude oil production and reserves increase in decades for Alberta. The latest edition of the ERCB’s publication, Alberta’s Energy Reserves 2012 and Supply/Demand Outlook 2013–2022, shows a 14% increase in production and 9.5% increase in reserves over 2011 levels. In 2012, Alberta’s crude oil production totaled 556,000 bpd, with a yearly total of 204 million bbl. This increase is due to the higher production rates of horizontal wells.
In 2012, Alberta produced 1.9 MMbpd of raw crude bitumen from the oil sands, for a yearly total of 704 MMbbl, or a 10% increase over 2011’s crude bitumen production. The ERCB forecasts that Alberta’s annual raw crude bitumen production will total 3.8 MMbpd for a total of 1.39 Bbbl/year in 2022. The report notes that, since 1967, Alberta has produced about 8.8 Bbbl of raw crude bitumen from the oil sands and about 16.7 Bbbl of crude oil since 1914. Other report highlights include:
- Alberta’s total remaining established crude bitumen and crude oil reserves stood at 169.6 Bbbl, consisting of 167.9 Bbbl of crude bitumen and 1.7 Bbbl of crude oil.
- Remaining, established, marketable, conventional gas reserves stood at 33 Tcf, a decrease of 3% from 2011
- Remaining established reserves of NGLs stood at 1.6 Bbbl, down 1% from 2011.
Land sales stabilize at lower level. Alberta collected $13.21 million at its June 9, 2013, land sale. The average price of $215.08 per hectare was the second-lowest of the calendar year. The province sold 61,408 hectares at the land sale. So, year to date, the industry has spent $403.47 million in Alberta to tie up 1.16 million hectares, which has generated an average price of $347.87 per hectare.
As of June 2012, Alberta had collected $589.73 million on 1.35 million hectares, at an average price of $437.40 per hectare. Highlights of the sales included a bonus high bid of $2.26 million, submitted successfully submitted by Vertex for a 2,048-hectare license in northwestern Alberta, south of Grande Prairie.
In Saskatchewan, a June 2013 sale of petroleum and natural gas rights generated $9.6 million in revenue for the province. To date, revenue from three land sales held by the provincial government have earned $29.3 million. In the June sale, the Weyburn-Estevan area received the most bids, totaling $7.9 million. “We have seen production in the Bakken area (of Saskatchewan) reach 69,000 bpd, and this is driving investment in the area,” said provincial Energy and Resources Minister Tim McMillan. “The majority of the lands sold in the Weyburn-Estevan area are targeting Bakken-prone lands, accounting for more than 80% of the sale total.”
MEXICO
Activity in Mexico continued at an elevated pace last year, but that level of activity may be about to slow down noticeably. According to state firm Pemex, there were 1,238 wells drilled during 2012, up 19.7% from 1,034 wells in 2011. Footage drilled was 9.97 million, up 21.6% from 8.20 million in 2011.
Offshore activity totaled 50 wells, up 16.3%. Offshore footage drilled was 686,492 ft, down 1.6% from 697,602 ft. Crude and condensate production was down slightly at 2.593 MMbpd. Natural gas output was down 3.2%, at 6.4 Bcfd. Crude and condensate reserves were up 0.2% at 10.283 Bbbl.
During fourth-quarter 2012, Pemex conducted 3D seismic surveys totaling 6,791 km², an area 38% less than what was surveyed in the same quarter of 2011. In the Northern region, the firm surveyed 6,450 km², of which 94.5% were for exploration and 5.5% were for development.
During the same quarter, from October to December, Pemex gathered 2D seismic data over an area of 1,226.4 km², of which 86.2% were in the Northern region, and 13.8% were in the Southern region. These seismic surveys were 20.6% greater than the corresponding quarter in 2011 and were directed toward prospecting for shale gas deposits.
During fourth-quarter 2012, Pemex completed 344 wells, 17.4% more than in the same quarter of 2011, located mainly in the area of Agua Fría-Coapechaca-Tajín and Humapa-Bornita, in the Integral Tertiary Oil Production area of the Gulf of Mexico. Of the total, 95.6% of wells completed were for development, and 4.4% were exploratory. An additional 15 exploratory wells were also completed, which is 114.3% more than in the same quarter of 2011. The completion rate for exploratory wells was 66.7%, which included five oil- and gas-producing wells, three gas-and-condensate wells, one dry gas well, and one wet gas well. Three wells were declared unproductive, due to water content. During the same fourth quarter, 329 development wells were completed, 43 more than in the identical quarter of 2011.
During fourth-quarter 2012, average crude oil production was 2.56 MMbpd, a 0.4% increase over equivalent production in fourth-quarter 2011. Most of the increase came from the Cinco Presidentes, Tabasco Gulf Coast, Poza Rica-Altamira and Abkatun-Pol-Chuc production fields. As of Jan. 1, 2013, estimated total reserves (3P)—proved, probable and possible—were 44.53 Bbbl of crude oil, with 31.2% proven, 27.6% probable and 41.2% possible.
During first-quarter 2013, 3D seismic data were gathered over 5,114 km², which is 12% less than the amount collected in first-quarter 2012. There were also 549.7 km of 2D seismic obtained, or 19.4% less than the amount gathered a year earlier. About 48% of the data were from the Northern region, and 52% were in the Southern region.
During first-quarter 2013, 252 wells were completed, 5.6% less than the first-quarter 2012 total. During this quarter, four exploratory wells and 248 development wells were completed. Of the 244 production wells completed, 216 produced oil and gas, 24 were gas/condensate, and four were dry gas. During first-quarter 2013, crude oil production averaged 2.544 MMbpd, a 0.1% increase in volume over the first-quarter 2012 rate. The most important factors in the production increase were wells in the Ku-Maloob-Zaap, Abakatun-Pol-Chuc, Veracruz, Gulf of Mexico Tertiary Oil, and Burgos fields. The fields made up for production declines in Samaria-Luna, Cantarell and Litoral de Tabasco fields. 
|


