What’s new in exploration
A photo worth a thousand rock properties
|
I am an avid photography enthusiast. I have been since my teens. I have plenty of pictures of rigs in sunsets, in sunrises, in storms offshore and myriad other scenarios, not to mention pumping units silhouetted against purple West Texas skies. It never occurred to me, however, that cameras and the familiar red, green and blue spectrum might find a use in the oil and gas industry outside beautiful pictures. Fortunately, it did to the folks at Ellington & Associates, a geoscience laboratory and wellsite services company specializing in paleontology and rock analysis in Houston. Specifically, they have put photography to work evaluating cuttings to help determine stratigraphic well correlation on the fly at the wellsite through worldwide mudlogging companies, and after the fact, in the lab. They have named this patented method and service: Chromastratigraphy. Chromastratigraphy is stratigraphic service that studies how changes in the color of lithologic strata relate to the changing composition of the strata, and the quantification of these changes to identify stratigraphic variation. By accurately recording and reproducing the stratigraphic colors, a visual record of the stratigraphic column can be created from ditch cuttings or core samples. Chromastratigraphy relies on the changing abundance and composition of rock forming constituents; principally, minerals, organic molecules and compounds, and cementing agents. As the relative abundances of these constituents change, the perceived color of the sample will likewise change. Color is measured by digitally recording the electromagnetic spectrum of each sample in the near ultraviolet-visual, near infrared range (the wavelengths humans can perceive, from approximately 390 nm to 750 nm). In addition to more common logs, the technology can be a standalone stratigraphic correlation tool and, in many areas, a substitute or proxy for TOC and paleo events. The potential of this service is to combine it in geosteering programs as a second data point in troubled lithologic areas. For years, Ellington observed significant color variations while processing washed well cuttings and core rock samples. Early on, these variations were not investigated because there was no accurate way to define the observed color changes, or to measure them. The use of color as a descriptive tool for geologic samples has traditionally relied upon qualifying modifiers such as “light” and “dark” to describe the varied range of rock values and hues. Attempts at more systematic methods have relied upon descriptive systems, such as Munsell Soil Color Charts, but, without graphical methods to display the data, it was difficult to identify and see patterns. In 2010, the company decided to determine if sample color could be captured digitally, standardized, and used as a correlation tool. The result was a procedure using protocols and software to prepare and analyze well samples for color. The analyses provide the following information:
A number of factors influence the observed and measured colors. Mineralogy and thermal history are key, as is lithology, specifically including grain size and cementation. Geochemistry also has a large influence on color, due to inorganic compounds (sulfides, etc.), organic compounds (TOC), redox conditions at deposition (i.e., anoxia) and post-depositional chemical alteration. The analytical process begins with raw cuttings samples delivered from the rig, which are carefully washed, finely ground and mixed with water to fully hydrate them. The resultant slurry is photographed under carefully controlled light in specially-designed photographic chambers using a digital camera and a spectrophotometer. The RGB spectrum of the image is then processed, analyzed, and a gray-scale correlation generated. Together, the RGB analysis and gray-scale index indicate minerology, lithology, TOC and thermal maturity that are correlated with depth.
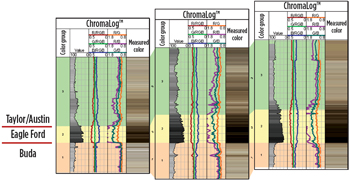
The ChromaLog can be integrated with traditional gamma-ray logs for log correlation and additional definition. On a larger, regional scale, Chromastratigraphy logs can be used for regional stratigraphic correlation such as illustrated in Fig. 1 showing distinct, correlatable changes in the Austin-to-Buda formations in the South Texas Eagle Ford play.  |

- Prices and governmental policies combine to stymie Canadian upstream growth (February 2024)
- U.S. producing gas wells increase despite low prices (February 2024)
- U.S. drilling: More of the same expected (February 2024)
- U.S. oil and natural gas production hits record highs (February 2024)
- Quantum computing and subsurface prediction (January 2024)
- U.S. upstream muddles along, with an eye toward 2024 (September 2023)
- Applying ultra-deep LWD resistivity technology successfully in a SAGD operation (May 2019)
- Adoption of wireless intelligent completions advances (May 2019)
- Majors double down as takeaway crunch eases (April 2019)
- What’s new in well logging and formation evaluation (April 2019)
- Qualification of a 20,000-psi subsea BOP: A collaborative approach (February 2019)
- ConocoPhillips’ Greg Leveille sees rapid trajectory of technical advancement continuing (February 2019)


