BETTINA BACHMANN, RUPERT COLE and LES RUTHVEN, Shell Global Solutions
The oil and gas industry, including Shell, has spent many millions of dollars acquiring wide-azimuth (WAZ) seismic data around the world. The industry also continues to develop seismic acquisition strategies and processing tools to reduce data costs and optimally de-noise and image it. However, few tools are yet available to interpret the data in all five dimensions of the WAZ data space: two coordinates that position the seismic trace on the surface of the earth; one vertical time or depth axis; and two coordinates that relate the separation between the seismic source and the receiver in distance and angle (azimuth).
Shell’s proprietary software platform, called GeoSigns, houses a comprehensive suite of integrated interpretation and visualization techniques. GeoSigns was developed by a specialist body within Shell, Technical & Competitive IT (TaCIT), that is focused on creating powerful information technology solutions, to find and deliver more oil and gas from increasingly complex, challenging and new types of reservoirs. It is Shell’s global standard for subsurface interpretation, and the vehicle by which the company deploys new interpretation technologies and capabilities. It is in use by about 1,000 geoscientists and on more than 1,000 individual projects.
In 2010, the existing functionality in GeoSigns for viewing, analyzing, and interpreting individual, or pre-stack, seismic traces was extended to a fifth dimension to support WAZ data. In 2011, yet more functionality was added. This article will highlight Shell’s WAZ capabilities in GeoSigns and demonstrate how this flexible toolset is helping the company build a more accurate picture of the subsurface by visualizing and extracting information from data, rather than simply averaging it through various processing steps into a single data point.
VALUE OF WIDE AZIMUTH SEISMIC
Traditional 3D seismic data are considered “narrow azimuth,” because the source and receivers all effectively lie along a single direction. WAZ seismic data are acquired in a variety of ways to increase the range of available angles from which the target is viewed. Like walking around a statue in a museum to view it from all sides, WAZ acquisition may involve multiple, narrow-azimuth passes from different directions. It may also involve a source on a second vessel, shooting the source at a right angle to the receiver line (common on land), sailing in overlapping concentric circles, or deploying receivers on the seafloor (Ocean Bottom Sensor or OBS nodes) while a source boat sails in a dense pattern above.
All of these techniques provide much more data about each subsurface location than thenarrow azimuth method—in some cases, hundreds or thousands of extra traces for a dense sampling over the full 360° azimuth range. These additional data can contain critical information about the structure and properties of the subsurface, and can expose potential risks and reveal opportunities.
WAZ seismic also applies to imaging beneath opaque layers in complex terrains, such as sub-salt or sub-basalt. In these instances, separate azimuths “illuminate” different parts of the subsurface, as the energy they contain passes through geological formations along different trajectories is distorted in different ways.
Reconstructing the signal from all the azimuths through advanced seismic imaging gives a more complete picture of these complex targets than was previously possible. WAZ data are also useful in looking for azimuthally anisotropic variations in properties, such as velocity or reflection strength, that might indicate optimal fracture orientations for drilling horizontal wells in unconventional plays. In addition, a WAZ survey more completely samples the seismic wavefield, leading to better noise reduction techniques.
MORE ABOUT GEOSIGNS
GeoSigns has been key to many of Shell’s recent exploration successes, including French Guiana, Brunei, Egypt, Brazil, the Gulf of Mexico, Canada and Nigeria. It is an integrated comprehensive suite of applications for seismic and non-seismic data interpretation for exploration and development. It includes tools for seismic processing quality control, seismic survey acquisition design, quantitative interpretation, production geoscience, volumetrics, and basin modeling.
In addition to WAZ, GeoSigns incorporates novel technologies, such as:
-
Trap Search Engine, which automatically and rapidly scans large seismic datasets, and finds subtle traps that interpreters might miss
-
Seismic Well Tie, which fits seismic to well logs more accurately and in a matter of seconds, leading to more accurate drilling predictions, lower drilling costs and safer wells.
-
Structural Framework Builder, which can build very large, complex water-tight models with hundreds of faults.
In all, Shell has incorporated 29 major proprietary technologies into GeoSigns, beyond some of the “off-the-shelf” tools found in commercially available interpretation software packages.
WAZ IN GEOSIGNS–FUNCTIONALITY AND DATA SAMPLES
The GeoSigns WAZ toolset was developed in close collaboration with key business users within Shell from the Projects and Technology directorate, from major business divisions, and from individual operating units in a particular country. The WAZ functionality was built on existing core interpretation and visualization capabilities by extending these to a fifth dimension.
Utilizing state-of-the-art, in-house software development methods, Shell designed the WAZ software, created and tested code, gathered user feedback, and continually refined the toolset during implementation. As an example, when one of Shell’s operating units requested a new type of pre-stack display to sort the WAZ traces in a particular way, known as a “snail gather,” this new display was developed and deployed within just a few weeks, and other users worldwide have since benefitted. By the close of 2010, an enhanced version based on feedback from many users was made available to the worldwide user community as Release 3.
The new WAZ toolkit is flexible enough to handle any of the commonly used WAZ dataspaces. These include radial distance and angle (think of a bicycle wheel centered on the data point) or two distances at right angles that define common vectors with different alignments (with each Common Offset Vector or COV making a cell in a large 2D grid). It is possible to load and view only the imaged and stacked data per azimuth to reduce the data volume but still provide the benefit of information acquired in different directions.
The key concept for viewing WAZ data in the pre-stack domain is to decide which of the available traces in the 5D data space one wants to view and what information in the data is important. For example, a seismic processor might want to compare only two azimuths (say 0° and 90°) to look for illumination or Residual Move Out (RMO) variations to verify a velocity model. Or, one might want to view all the available traces with some pre-defined sorting, so that azimuthal variations in velocity or amplitude become more easily visible. The system also offers the ability to create movies to explore the data space and animation to highlight subtle differences between the azimuths or offsets.
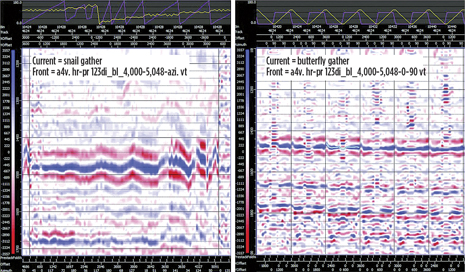
An example of the benefit of different gathers is shown in Fig. 1, where a snail gather of all WAZ traces shows obvious azimuthal variations as a wiggle on the right, indicating that the velocity model is not correct, whereas data along two azimuths show flat events, indicating the model is correct.
 |
| Fig. 1. Panel 1 (left) shows a Snail gather—increasing azimuth within increasing offset classes, poor signal-to-noise. The azimuthal variation is evident at the far offset (right-hand edge of the panel). Panel 2 displays Butterfly gathers comparing offset for two azimuths only (0° and 90°). The data show little move-out, indicating that the velocity model is correct. |
|
However, the GeoSigns WAZ functionality is more than just a clever seismic trace viewer that can slice and dice a 5D dataset. Shell also extends its horizon event object to support five dimensions, along with both manual and automatic picking, and attribute extraction. Events can be picked on any view of the data, and these seed picks can be propagated throughout the 5D dataspace. They can then be quality-controlled and edited, again making use of different views of the data to decide which offsets and azimuths contain valid data about the structure.
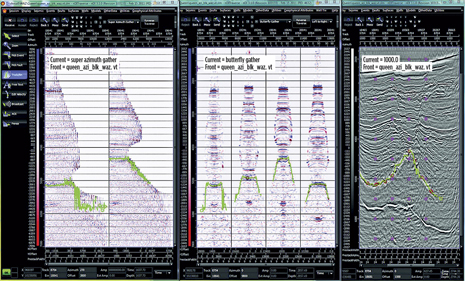
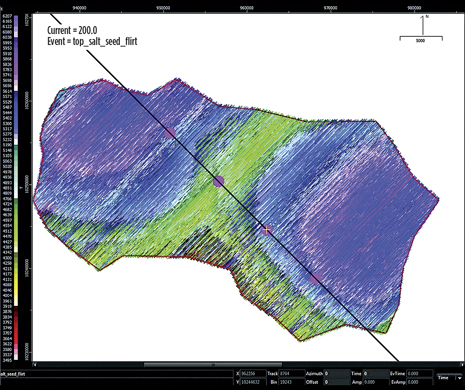
As the user roams through a 5D data space, it quickly becomes obvious that different gathers show different things. Noise left in the data from the original processing or mispicks on one or more azimuths, for example, might indicate that a better final image could be achieved by excluding this part of the data. This is highlighted in Figs. 2 and 3, where an auto-tracked event is shown on two different gather types and the mispicks at longer offsets are obvious, as the event deviates from horizontal toward the right. Contrast this with a traverse through just one common offset common azimuth slice, where the picks match the seismic.
 |
| Fig. 2. In the Panel 1 (left), we see three different views through an offset/azimuth OBC dataset. The image shows two pre-stack Super Azimuth gathers, all 280 traces in the dataset sorted by increasing azimuth per offset. The variation of move-out (non-flatness) of events with offset and azimuth is readily apparent. The power of this display for rapid quality control of picking is shown by the green event, which is an auto-tracked top salt. Auto-picking has done a good job out to a mute function (4,500–6,600-m offsets), but then it starts to follow high-energy that was not completely blanked. Panel 2 shows four Butterfly gathers that compare all offsets for only two of the eight azimuths in the dataset, 0° and 90°. The offsets for the 0° azimuth traces on the left have been reversed, such that the smallest values for both azimuths are in the middle of the panel, which should highlight move-out at the edges of the gather. Panel 3 shows a common offset, common azimuth traverse (offset 1,000 m, azimuth 0°) through the gathers (locations as pink dots). This shows the seed picks used by flirt (red circles) to produce the auto-tracked top-salt event (green). |
|
 |
| Fig. 3. The top-salt event from Fig. 2, showing the variation in the pick for all offsets and azimuths. The overall structure of the event is visible—a salt high in reds and yellows, flanked by two lows in purple, but the jitter shows the mispicks at longer offsets. |
|
Just how much data does this involve? For the area covered by the small Ocean Bottom Sensor (OBS) dataset shown in the examples, there are about a quarter-of-a-million traces. Multiply this by the number of offsets (35) and azimuths (8) and the product is a 280-fold increase, resulting in more than 69 million traces—too much to quickly or ergonomically interpret manually. This problem will only increase, as computer and visualization technology keeps pace with modern seismic acquisition techniques, and seismic volumes move into the petabytes.
Users can also apply on-the-fly signal-to-noise enhancement by averaging adjacent traces to improve the appearance of the data and make interpreting easier. An example of the power of on-the-fly substacking is shown in Fig. 4, where the image quality of a single trace traverse is progressively improved by first averaging over all azimuths and then all WAZ traces. The result is quite dramatic, with some subtle faulting now visible without having to run any additional pre-processing steps.
 |
| Fig. 4. Panel 1 (left) shows a traverse through a single-fold (one trace only) common offset, common azimuth volume. The structure is very hard to determine, due to the arcuate noise, especially along the bright event at the top, the seafloor reflection. Panel 2 shows the substack for this offset but across all eight azimuths. Some faults are now becoming apparent in the center of the image, but the event continuity is still quite poor. Panel 3 shows the result of stacking all traces in the dataset together, in this case 280 traces per location. The result is quite dramatic, with some subtle faulting now visible. The fold of the substack is indicated below the traces. |
|
Both the manual and auto-pickers work for this sub-stacked view, and some users have experimented with a mild enhancement to improve their residual move-out (RMO) picking as part of a velocity model updating exercise. Plans for extending this functionality in future GeoSigns releases include stacking traces within a polygon in WAZ data space and investigating data adaptive methods, including those being developed in Shell’s proprietary seismic processing software, called SIPMAP.
SUMMARY, CURRENT STATUS AND THE WAY FORWARD
Shell has long been a leader in subsurface technology. This commitment to superior technology is demonstrated by Shell being the only major oil and gas company to develop its own comprehensive interpretation and imaging platform.
Some vendors now offer visualization and interpretation capabilities for offset-only pre-stack data, but Shell users can view all or a subset of the available traces at single or multiple locations in a variety of ways. They can also easily visualize variations between different directions or offsets, enhance image quality on-the-fly, and map horizons within an established interpretation package. This enables them to build a more complete picture of the subsurface and allows Shell seismic processors to better understand and control the quality of their velocity models, leading to better imaging solutions.
Currently, there are few well-defined workflows for extracting the maximum benefit from WAZ data, so Shell concentrated on providing users with as much flexibility as possible, rather than optimizing just a few steps. This will allow them the freedom to experiment, see what works, and identify gaps that exist.
Worldwide WAZ data have been gathered from the Gulf of Mexico, onshore U.S., Canada, Oman, Egypt, Qatar, Yemen, Barents Sea, Libya, Indonesia, Angola and Gabon. Most of the experience within Shell comes from the Upstream Americas unit, where many improvements in subsalt imaging with both towed receiver and Ocean Bottom Seismic WAZ data are well-documented. The system has also proven itself in the Middle East, where it has made large-scale orthogonal land WAZ surveys a reality.
Shell has also deployed WAZ data to key users across Shell and its joint ventures through training and support visits. Lessons learned from these interactions, as well as new requirements driven by seismic imaging technology advances, are driving Shell’s 2012 development efforts. As Shell acquires more WAZ data, and the use of the GeoSigns platform increases, learnings will continue to guide development of next-generation tools and lead a step change in the way Shell processes and visualizes ever-increasing amounts of data. These and other new tools will give Shell a true competitive advantage in utilizing WAZ data and many other aspects of subsurface interpretation. 
|
The authors
BETTINA BACHMANN is vice president of subsurface software technologies in Shell's Projects and Technology organization in the Netherlands. With a background in geophysics from the ETH Zurich in Switzerland, Ms. Bachmann joined Shell in 1984 as an explorer and has since then filled numerous technical and asset leadership roles.
RUPERT COLE joined Shell in 1996 in the velocity model building team after earning a PhD in geophysics. Dr. Cole has worked in interpretation and seismic processing positions in the U.S. and Oman.
LES RUTHVEN earned BS degrees in mechanical engineering and mathematics from Wichita State University in 1981. Mr. Ruthven joined Shell in 1982 to develop applications to analyze offshore structures for Production Research. He is development lead for Shell's GeoSigns (nDI) seismic interpretation software. |
|


