PEDRO SALDUNGARAY and TERRY PALISCH, CARBO Ceramics
Often overlooked, conductivity can have a significant impact on both the long- and short-term productivity of a well, which can ultimately determine the well’s profitability.
 |
| A CARBO research chemist examines a CARBOBOND RCS sample under a scanning electron microscope to evaluate grain-to-grain bonding and ensure an optimal resin coating process. |
|
A primary goal in unconventional reservoirs is to contact as much rock as possible with a fracture or a fracture network of appropriate conductivity. This objective is typically accomplished by drilling horizontal wells and placing multiple transverse fracs along the lateral. Reservoir contact is optimized by defining the lateral length, the number of stages to be placed in the lateral, the fracture isolation technique and job size. Fracture conductivity is determined by the proppant type and size, fracturing fluid system and placement technique.
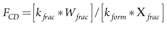
Fracture geometry optimization involves defining the desired fracture half-length, width and conductivity for maximized production. While there are several optimization methods, all involve a relative comparison of the flow potential of the fracture to that of the reservoir, as described by the dimensionless fracture conductivity (FCD) parameter:
For steady- or pseudosteady-state flow in oil wells, several authors [Prats 1961, Cinco-Ley 1981, McGuire & Sikora 1960] have developed correlations that allow the engineer to use FCD to predict the benefits of the fracture stimulation, yielding a method that balances fracture half-length and drainage area with fracture conductivity for stimulation design. FCD is also used to optimize fracture design in such methods as the Unified Fracture Design [Economides 2002]. The FCD concept and various related fracture optimization methods are well understood, but many people in the industry fail to identify the fracture permeability to plug into the equation that is correctly estimated at downhole flow conditions [Palisch 2007].
While most parameters are considered in great detail in the completion design, fracture geometry and conductivity receive less attention. Some people mistakenly anticipate that in formations with extremely low permeability, hydraulic fractures act as “infinitely conductive” features. However, many factors that affect the realistic conductivity of the fracture are poorly understood or overlooked. This often leads to a less-than-optimal outcome with wells producing below the reservoir potential.
FRACTURE CONDUCTIVITY
While the fracture conductivity required to economically produce a horizontal well in an unconventional play, and to improve hydrocarbon recovery, will vary in different reservoirs, many engineers fail to recognize the conductivity requirements to accommodate high-velocity hydrocarbon flow in transverse fractures. The pack conductivity for a given proppant is a function of the proppant particle size, strength, grain shape (roundness and sphericity), embedment into the frac faces, fracturing fluid residue, fines migration, effective stress on proppant and fluid flow effects (non-Darcy and multi-phase flow), which can be very pronounced in the limited intersection between a wellbore and a transverse fracture. When accounting for these effects, it is not uncommon for proppant pack reference conductivity to be reduced by two orders of magnitude [Palisch 2007 and Miskimins 2005].
Conductivity testing and its limitations. To understand realistic conductivity, one must first understand how conductivity is measured and reported. The fracture conductivity represents the product of the fracture permeability and the fracture width.
ISO-13503-5 and API-RP-19D set the testing standards for evaluating sand, ceramic media, resin-coated proppants, gravel packing media, and other materials used for hydraulic fracturing and gravel packing operations. While providing a consistent methodology for proppant conductivity testing and comparing proppant materials under comparable laboratory conditions, API-RP-19D specifically states it “is not intended for use in obtaining absolute values of proppant pack conductivities under downhole reservoir conditions” [API 2008].
The current procedure consists of placing a representative sample of proppant at 2 lb/ft2 in the test cell between two Ohio sandstone wafers with a Young’s Modulus (YM) of 5 million psi. The cell is heated to 150°F or 250°F, depending on proppant type, and stress is ramped at a prescribed rate to the first test point. After 50 hr, measurements are made, and the process can be repeated at each desired stress, holding for an additional 50 hr at each stress. Conductivity is calculated by applying Darcy’s Law from the pressure drop produced by a 2 ml/min, 2% KCl flow stream through the proppant pack.
Although these standard conditions allow for comparable testing between proppants, they rarely represent the realistic conditions in which proppant is placed in hydraulic fractures [Vincent 2009]. As such, these procedures ignore many parameters that affect the actual conductivity of the frac. Further complicating matters, different proppant types may be affected differentially by each parameter. A brief description of the key effects is given below.
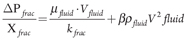
Non-Darcy and multiphase flow effects. The ISO/API test flowrate of 2 ml/min is not representative of actual flowrates in a proppant pack. This rate would equate to ~6 bpd in a fully perforated, vertical oil well, with a 50-ft tall, bi-wing frac achieving 2 lb/ft2 concentration, or ~15 Mcfd flowing at 1,500 psi and 250°F in a similar dry gas well. The fluid velocities resulting from more prolific wells will cause tremendous amounts of energy to be lost, which translates into additional pressure losses not described by Darcy’s Law. Forchheimer’s equation below includes the non-Darcy pressure drop (βρν2) component for a single-phase fluid and is dominated by the velocity-squared term [Forchheimer 1901]. Interpreting this extra pressure drop as a conductivity reduction typically shows a fracture conductivity impairment of 50% to 85% [Palisch 2007].
Additionally, the fluid circulated in the ISO/API tests is a solution of silica-saturated, oxygen-free 2% KCl water. In reality, oil and gas wells rarely produce 100% water, or even a single-phase fluid. Instead, two or three phases are typically present (oil, water and gas), yielding a much more complex flow regime than tested in the lab. Lab data consistently demonstrate that pressure losses in the fracture may increase significantly, when both liquid and gas phases are mobile within the fracture. This is typically attributed to the highly inefficient flow regime that occurs when gas, oil and water molecules move through the proppant pack, each moving at a different velocity. In fact, some researchers tend to consider multiphase flow impacts as a multiplier to non-Darcy effects, since the impacts are most pronounced at high-velocity flow. Unfortunately, significant pressure losses are documented, even when only small percentages of a second phase are mobile within the fracture, Fig. 1.
![Fig. 1. The impact of multiphase flow can be dramatic at very low fractional flowrates of liquid [Palisch 2007].](/uploadedimages/Issues/Articles/Mar-2012/WO0312-Hydraulic-Saldungaray-Fig-01.gif "Fig. 1. The impact of multiphase flow can be dramatic at very low fractional flowrates of liquid [Palisch 2007].") |
| Fig. 1. The impact of multiphase flow can be dramatic at very low fractional flowrates of liquid [Palisch 2007]. |
|
Proppant loading at 2 lb/ft2. It is generally accepted that in most slickwater or hybrid frac stimulations, the effective proppant loading achieved in the fracture is less than 1 lb/ft2. This means that the fracture is narrower than in the ISO/API test. In addition to directly impacting conductivity via the conductivity equation, the much narrower width produced by the reduced concentration also increases the fluid velocity through the pack for a given flowrate. This, in turn, exacerbates the non-Darcy and multiphase flow effects in the fracture. If the fracture width is halved, and hydrocarbon velocity is doubled, then non-Darcy pressure losses are increased by a factor of 400%.
Embedment and spalling. The ISO/API test uses a sandstone core with a YM of 5 million psi. Many shale and unconventional reservoirs are significantly softer than these sandstone cores (e.g., the Eagle Ford shale has a YM of 1-3 million psi). Softer rock leads to a loss of width and conductivity, due to both proppant embedment and formation spalling. The reduced width has the double effect of diminishing conductivity in direct proportion, and increasing fluid flow velocity, due to the smaller cross-section of the resulting proppant pack. As a consequence, non-Darcy pressure losses will also be increased.
Temperature effects. The ISO/API conductivity test is performed at 150°F for sand proppant and 250°F for ceramic proppant. The reason for this difference is primarily because higher temperatures have a known detrimental impact on sand and sand-based proppants, such as resin-coated sand. As temperatures exceed 200°F, sand-based products can experience a significant decrease in conductivity. For example, an uncoated sand, when exposed to 250°F at 6,000-psi stress, will lose 40% of its conductivity compared to 150°F, and this loss jumps to nearly 80% at 300°F and 8,000 psi. Coating the sand with a resin lessens the damage, because the resin can encapsulate the crushed fines. However, even resin-coated sand loses 30% of its conductivity at 8,000 psi and 300°F.
Ceramic proppants are tested at 250° F, due to their thermal stability. These proppants are sintered at ~2,700°F and are engineered for improved sphericity, strength and thermal resistance. Therefore, no correction is required when placing a ceramic proppant into higher temperature formations.
Cumulative conductivity impact. When all of these effects are taken together, the overall impact of these damage mechanisms on the conductivity at actual bottomhole flowing conditions can be severe. In fact, it is not uncommon to see the overall loss of conductivity exceeding 90%, Fig. 2. While all proppants experience these several orders of magnitude reduction in conductivity, the individual damage mechanisms can have different impacts on the various proppant types [Schubarth 2006]. While the above conductivity damage is already severe, there are also other downhole realities that can exacerbate the damage, including long-term conductivity degradation and gel/fluid residue damage, as well as many other mechanisms [Palisch 2007, Barree 2003, Pearson 2001]. Regardless of the exact magnitude of these reductions, the bottom line is that the realistic conductivity in all hydraulic fractures is much less than measured in standard lab testing, and reported in industry literature. Further, if these reductions are not accounted for when designing hydraulic fractures and selecting the appropriate proppant, significant production may be deferred or, in some cases, not recovered in the existing completion [Blackwood 2011].
![Fig. 2. The cumulative reduction in conductivity due to several damage mechanisms not accounted for in the standard ISO/API test [Palisch 2007].](/uploadedimages/Issues/Articles/Mar-2012/WO0312-Hydraulic-Saldungaray-Fig-02.gif "Fig. 2. The cumulative reduction in conductivity due to several damage mechanisms not accounted for in the standard ISO/API test [Palisch 2007].") |
| Fig. 2. The cumulative reduction in conductivity due to several damage mechanisms not accounted for in the standard ISO/API test [Palisch 2007]. |
|
PROPPANT SELECTION
The most common completion in unconventional plays consists of a horizontal wellbore with multiple proppant fracs placed along it. Despite ultra-low reservoir permeability driving up FCD, high-conductivity proppant is still needed, given the detrimental effects. On top of the conductivity considerations, there are several other issues that must be addressed when selecting the appropriate proppant for use in these multi-stage fracs, including flow convergence in transverse fracs, proppant transport when low-viscosity fluids are employed and proppant crush at typically low concentrations.
Flow convergence in transverse fracs. Production into a horizontal wellbore from an orthogonal fracture will exhibit linear flow in the far field as it travels down the fracture. However, as the fluids converge on the relatively small diameter of the wellbore, the fluid velocities in that region increase dramatically. In fact, if one considers a single, planar, 100-ft-tall vertical fracture, and places it fully connected in a vertical well and transversely in a horizontal, 6-in.-diameter wellbore, the fluid velocity near the wellbore would be 127 times higher in the transverse fracture as compared to the vertical well. Further, since velocity is a squared term in the Forchheimer calculation, the pressure drop in the transverse frac could be over 16,000 times greater than in a fully connected vertical well. This leads to the conclusion that it is practically impossible to place enough conductivity near the wellbore in a transverse, horizontal well to be fully optimized.
Proppant transport and placement. Proppant placement is governed by a series of mechanisms involving the interaction between the fracturing fluid and proppant. A number of issues have been investigated through time that impact how proppant is transported into the frac and its final location in the created geometry. Proppant density and size have a determining impact on proppant settling, which, in turn, impacts where proppant will be placed in the frac.
The settling rate is directly proportional to the difference in density between the fluid and proppant, and inversely proportional to the fluid viscosity. This condition makes settling an important consideration when pumping low-viscosity Newtonian fluids, as are typically used in horizontal multi-frac treatments conducted in dry gas shales. Two components are directly controlled by the proppant: density and diameter. While much attention is typically given to density, diameter can actually be of greater importance in a fracturing treatment. As stated in Stoke’s law, settling velocity is proportional to particle diameter squared, thus having an exponentially larger effect on settling rate than fluid viscosity. Stoke’s Law may have limitations describing setting under dynamic conditions in a slurry situation, but it does serve the purpose to illustrate how smaller and lighter proppant aid easier placement.
Proppant crush at low concentrations. The typical low-proppant concentrations pumped in waterfracs often designed for unconventional gas reservoirs can result in a low areal concentration being placed in the frac. Values between 0.25 and 0.50 lb/ft2 are typical and much lower than the 2 lb/ft2 used in the standard ISO/API conductivity test. These narrower fractures can have an impact on proppant crush. Inside a crush cell, interior grains are protected, due to their contact with six to twelve neighboring grains. However, exterior grains have fewer contact points, leading to greater stress at the points of contact, ultimately fracturing. Therefore, as proppant pack width and areal concentration decrease, the exterior grains comprise a larger percentage of the total grains in the pack, leading to higher proppant crush [Palisch 2009].
Some researchers have proposed partial monolayers as a means to boost conductivity, the idea being that voids between grains would provide open paths with infinite conductivity [Brannon 2004, Parker 2005]. Using conventional proppants, a partial monolayer will occur at concentrations of <0.20 lb/ft2, where less than a single layer of proppant should occur. While there is significant debate regarding whether partial monolayers can be reliably achieved over large portions of a created frac [Gidley 1989, Palisch 2008], even if they can be successfully placed, many people overlook the increased stress concentrated on individual proppant grains. This will lead to higher crush, higher embedment, and ultimately, loss of fracture width and conductivity.
Various specialty proppants have been introduced to exploit the advantages of partial monolayers, as well as purportedly to promote their placement. Most of these new proppants are of much lighter density. In many cases, they do not crush as conventional rigid particles do, but instead deform, which is one reason why they are typically only considered useful at low stress. Independent testing has shown that if these deformable proppant grains are actually placed in a traditional pack, whereby they come in contact with each other, the grains tend to squish together and create a relatively impermeable plug [Stimlab 2009-2010].
CASE HISTORIES
When one understands the realistic conditions within the proppant pack, and their impact on fracture conductivity, it becomes apparent that the fracture-flow capacity is not optimized. One of the easiest ways to increase conductivity is to upgrade the proppant size and/or type. As one moves up the proppant conductivity pyramid, fracture conductivity (and production) improves, Fig. 3. However, this carries with it an increase in completion cost, so the decision to increase conductivity must also involve an economic analysis.
![Fig. 3. The economic conductivity pyramid showing the three tiers of proppant. As one moves up the triangle, conductivity improves [Gallagher 2011].](/uploadedimages/Issues/Articles/Mar-2012/WO0312-Hydraulic-Saldungaray-Fig-03.jpg "Fig. 3. The economic conductivity pyramid showing the three tiers of proppant. As one moves up the triangle, conductivity improves [Gallagher 2011].") |
| Fig. 3. The economic conductivity pyramid showing the three tiers of proppant. As one moves up the triangle, conductivity improves [Gallagher 2011]. |
|
What follows are several case histories from unconventional reservoirs in which proppant was selected, considering the realistic conductivity at bottomhole flowing conditions and the economic impact on the completion. These cases illustrate the robustness of our approach, and demonstrate the production and economic benefits of placing enhanced conductivity in ultra-low permeability formations.
Barnett shale. The Barnett is a thermogenic reservoir, averaging 4.5% total organic content (TOC). As is the case with all shale gas plays, the primary challenge is the ultra-low permeability of <0.0001 milliDarcies (md). An actual Barnett Shale completion was history-matched, and then sensitivities were performed to several parameters, including fracture conductivity and fracture stage spacing. The well of interest utilized a Tier 3 uncoated sand and was stimulated using a slickwater fluid system. The history match indicated that the realistic fracture conductivity was ~2 md-ft, and showed that if the conductivity was increased from 2 md-ft to 20 md-ft, the well would see a 1-Bcf increase in the 15-year cumulative production. The optimal staging between fractures was highly dependent on the fracture conductivity. As the fracture conductivity was increased, the optimal spacing increased. While all scenarios modeled would need to be evaluated on a cost vs. benefit basis, the study illustrated the importance of accurately estimating the realistic fracture conductivity, as well as the overall value of increasing conductivity.
Haynesville shale. The Haynesville is a black, organic-rich shale, with a TOC of 3-5% and 1.3-2.4 vitronite reflectance. While porosity is moderate (6-12%), permeability is extremely low (5-800 nD). The Haynesville shale also has elevated temperature (>300° F) and reservoir pressure (0.84-0.88 psi/ft) [Pope 2009, 2010]. Since most Haynesville operators initially adapted their frac designs from their experiences in the Barnett, the primary fluid system of choice was either a slickwater or “hybrid” design. Small mesh (40/70 or 40/80) proppant was primarily utilized, given transport concerns with low-viscosity fluids. At realistic conditions, Tier 1 proppants have two to 20 times the conductivity as Tier 2 and Tier 3 proppants, respectively [Pope 2009]. However, despite the high temperatures and stresses, and this conductivity disparity, operators in the Haynesville have used tremendous volumes of all three tiers of proppants, due primarily to higher cost and limited availability of Tier 1 proppants.
This large diversity of proppant usage has allowed for an opportunity to evaluate actual field performance comparing proppant types. One such study is comprised of a well set containing 56 wells, operated by the same company within a 5-mi radius [Pope 2010]. Twenty of these wells were known to contain Tier 1 40/80 LWC, while 36 offset wells were known to contain primarily a Tier 2 40/70 Premium RCS. While there is significant debate over whether initial production (IP) is a good indicator of completion performance in shale gas plays, the authors illustrated that increasing the conductivity from Tier 2 to Tier 1 of the fracture yielded a nearly 50% increase in IP, normalized for flowing pressure and lateral length. Over the long term, a comparison of production for the same operator shows the Tier 1 wells are producing, on average, 20% more normalized production after 6 months than the Tier 2 wells. In addition, a smaller subset of wells (10 Tier 1 and 19 Tier 2), has at least 12 months of production. In these wells, the Tier 1 completions had produced 30% more normalized production than Tier 2. The authors hypothesized that this increase may be indicative of the durability advantage of the Tier 1 proppant [Pope 2010].
Bakken shale. Average porosity at the Bakken is ~5%, and permeability is on the order of 0.04 mD. While the Bakken is not as deep or hot as the Haynesville, it is primarily an oil play and, therefore, requires additional conductivity to effectively convey the oil into the wellbore [Rankin 2010]. Many operators in the Bakken are using either Tier 1 ceramics or Tier 2 RCS. One Bakken operator has published results showing the benefits of increasing the conductivity, while at the same time maximizing the number of stages in the well, utilizing a plug-and-perf methodology in uncemented liners. Initial publications were based on a relatively small well count [Rankin 2010], but indicated a tremendous increase in well productivity when comparing Tier 1 ceramic completions to Tier 3 wells. However, this same operator revisited the well set, adding additional wells and time data [Vincent 2011]. After nearly two years of production, Tier 1 ceramic wells with more stages are producing twice the production of Tier 3 wells with fewer stages. Although the authors did not provide cost or economic data, it is estimated that the Tier 1 wells are generating ~$4 million in incremental value per well after just one year, while the cost to upgrade from Tier 3 and sliding sleeves to Tier 1 and plug-and-perf is approximately $800,000. This represents a tremendous return on investment, which continues to grow as the incremental production appears to increase over time.
CONCLUSIONS
When selecting proppant, one must account for conductivity reductions, so that the optimal FCD and completion can be employed. In addition, selecting the appropriate proppant for use in multi-stage fracs in horizontal wells of unconventional reservoirs requires accounting for several additional impacts, including flow convergence in transverse fracs, proppant transport if low-viscosity fluids are employed, and proppant crush at the typical, low concentrations achieved in many resource plays.
The proppant selection process must evaluate the technical merits of the available proppant options, the resulting impact on well performance, and the fracture treatment cost. The process for selecting proppant is ultimately an economic decision, based on calculating the conductivity of the fracture at realistic conditions, predicting the production performance for each proppant option, evaluating the cost vs. benefit of each, and selecting the proppant that maximizes the economics of the completion. The validity of the analysis must then be confirmed by the actual field results. 
ACKNOWLEDGEMENT
This article is based on paper 151128, presented at the SPE Middle East Unconventional Gas Conference and Exhibition held in Abu Dhabi, UAE, Jan. 23-25, 2012.
NOMENCLATURE
ASG Apparent Specific Gravity
cp Centipoise
ΔP Pressure drop or Delta Pressure
°F, deg F degrees Fahrenheit
FCD Dimensionless Fracture Conductivity
HMF Horizontal Multi Fractured
K, k Permeability
kfrac Fracture permeability
kform Formation permeability
KCl Potassium Chloride
LWC Lightweight Ceramic
mD milliDarcies
RA Radioactive
RCS Resin-coated Sand
SRV Stimulated Reservoir Volume
v Velocity
vfall Settling rate
wfrac Fracture width
YM Young’s Modulus
Xf, Xfrac Fracture half-length
ß Coefficient of Inertial Resistance
γ Specific gravity
µ Viscosity
φ Density
LITERATURE CITED
1. API-RP-19D, “Recommended practice for measuring the long-term conductivity ofpProppants,” First Edition, May 2008, API Publishing Services.
2. API-RP-61, “Recommended practices for evaluating short-term proppant pack conductivity,” 1989, API.
3. Barree, R.D., et al., “Realistic assessment of proppant pack conductivity for material selection,” SPE-84306, presented at the SPE Annual Technical Conference, Denver, Colo., Oct. 5-8, 2003.
4. Bazan, L.W., et al., “Improving production in the Eagle Ford shale with fracture modeling, increased conductivity and optimized stage and cluster spacing along the horizontal wellbore,” SPE-138425, presented at the SPE Tight Gas Completions Conference, San Antonio, Texas, Nov. 2-3, 2010.
5. Besler, M.R., et al., “Improving well productivity and profitability in the Bakken – A summary of our experiences drilling, stimulating and operating horizontal wells,” SPE-110769, presented at the SPE Annual Technical Conference and Exhibition, Anaheim, Calif., Nov. 11-14, 2007.
6. Blackwood, K.W., et al., “Evaluating the long-term benefits of improved fracture treatments,” SPE-147436, presented at the SPE Annual Technical Conference and Exhibition, Denver, Colo., Oct. 31 – Nov. 2, 2011.
7. Brannon, H.D. et al., “Maximizing fracture conductivity with proppant partial monolayers: Theoretical curiosity or highly productive reality?,” SPE-90698, presented at the SPE Annual Technical Conference and Exhibition, Houston, Texas, Sept. 26-29, 2004.
8. Cinco-Ley, H. and F. Samaniego-V., “Transient pressure analysis for fractured wells”, JPT (Sept. 1981) p. 1749.
9. Cipolla, C.L., “Modeling production and evaluating fracture performance in unconventional gas reservoirs,” SPE-118536, SPE Distinguished Author Series, 2009.
10. Cipolla, C.L. et al., “Fracture design considerations in horizontal wells drilled in unconventional gas reservoirs,” SPE-119366, presented at the SPE Hydraulic Fracturing Technology Conference, The Woodlands, Texas, Jan. 19-21, 2009.
11. Dayan, A. et al., “Proppant transport in slickwater fracturing of shale-gas shale formations,” SPE-125068, presented at the SPE Annual Technical Conference and Exhibition, Denver, Colo., Sept. 21-24, 2008.
12. Economides, M., Unified Fracture Design, Orsa Press, Houston, May 2002.
13. Economides, M. and K. Nolte, Reservoir Stimulation, Third Edition, published by John Wiley & Sons, 2000.
14. Forchheimer, P., “Wasserbewegung durch Boden,” ZVDI (1901) vol. 45, p. 1781,
15. Gallagher, D., ”The hierarchy of oily conductivity,” Guest Editorial, JPT, April 2011, p. 18.
16. Gidley, J.L. et al., "Monograph 12 – Recent advances in hydraulic fracturing," p. 118-119, AIME, SPE, Richardson, Texas, 1989.
17. International Organization for Standardization, “Procedures for measuring the long-term conductivity of proppants,” ISO 13503-5, July 2006.
18. Lattibeaudiere, M.G., “Stimulation design using ceramic proppant: One operator’s perspective,” presented at the SPE Eagle Ford ATW, Austin, Texas, Aug. 24-26, 2011.
19. Mayerhofer, M.J. et al., “What is stimulated rock volume?” SPE-119890, presented at the SPE Shale Gas Production Conference, Dallas, Texas, Nov. 16-18, 2008.
20. McGuire, W. J., et al., "The effect of vertical fractures on well productivity," SPE-1618-G, Journal of Petroleum Technology (October 1960) 12, p. 72-74; Also in Trans., AIME (1960), p. 219.
21. Mobbs, A.T. and P.S. Hammond, “Computer simulations of proppant transport in a hydraulic fracture,” SPE-69212, Journal SPE Production & Facilities, 2001.
22. Norris, M. et al., “Multiple proppant fracturing of horizontal wellbores in a chalk formation: Evolving the process in the Valhall field,” SPE-50608, presented at the SPE European Petroleum Conference, The Hague, The Netherlands, Oct. 20-22, 1998.
23. Palisch, T. et al., “Determining realistic fracture conductivity and understanding its impact on well performance – Theory and field examples”, SPE-10630, presented at the SPE Hydraulic Fracturing Technology Conference, College Station, Texas, Jan. 29-31, 2007.
24. Palisch, T. et al., “Slickwater fracturing – Food for thought,” SPE-115766, presented at the SPE Annual Technical Conference and Exhibition, Denver, Colo., Sept. 21-24, 2008.
25. Palisch, T. et al., “How to use and misuse proppant crush tests—Exposing the top 10 myths,” SPE-119242, presented at the SPE Hydraulic Fracturing Technology Conference, The Woodlands, Texas, Jan. 19-21, 2009.
26. Parker, M. et al., “High-porosity fractures yield high conductivity,” SPE-96848, presented at the SPE Annual Technical Conference and Exhibition, Dallas, Texas, Oct. 9-10, 2005.
27. Pearson, C.M., “Dimensionless fracture conductivity: Better input values make better wells,” SPE-60184, JPT (January 2001).
28. Pope, C. et al., “Haynesville shale—One operator’s approach to well completions in this evolving play,” SPE 125079, presented at the SPE Annual Technical Conference and Exhibition, New Orleans, Lou., Oct. 4-7, 2009.
29. Pope, C. et al., “Improving stimulation effectiveness—Field results in the Haynesville shale,” SPE 134165, presented at the SPE Annual Technical Conference and Exhibition, Florence, Italy, Sept. 19-22, 2010.
30. Prats, M., "Effect of vertical fractures on reservoir behavior—Incompressible fluid case," SPE-1575-G, SPE Journal (June 1961) 1, No. 1, p. 105-118; Also in Trans., AIME (1961), p. 222.
31. Rankin, R. et al., “Improved production and profitability achieved with superior completions in horizontal wells: A Bakken/Three Forks case history,” SPE-134595, presented at the SPE Annual Technical Conference and Exhibition, Florence, Italy, Sept. 19-22, 2010.
32. Shah, S. et al., “Fracture orientation and proppant selection for optimizing production in horizontal wells,” SPE-128612, presented at the SPE Oil and Gas India Conference and Exhibition, Mumbai, India, Jan. 20-22, 2010.
33. Schubarth, S.K. et al., “Using reservoir modeling to evaluate stimulation effectiveness in multilayered ‘tight’ gas reservoirs: A case history in the Pinedale Anticline area,” SPE-100574, presented at the Gas Technology Symposium, Calgary, Alberta, Canada, May 15-17, 2006.
34. StimLab Proppant Consortium notes from 2009-2010.
35. Vincent, M.C., “Proving it—A review of 80 published field studies demonstrating the importance of increased fracture conductivity,” SPE-77675, presented at the SPE Annual Technical Conference and Exhibition, San Antonio, Texas, Sept. 29–Oct. 2, 2002.
36. Vincent, M.C., “Optimizing transverse fractures in liquid-rich formations,” SPE-146376, presented at the SPE Annual Technical Conference and Exhibition, Denver, Colo., Oct. 31–Nov. 2, 2011.
THE AUTHORS
|
|
PEDRO SALDUNGARAY is technical manager–EAME region for CARBO Ceramics, based in Dubai, UAE. He has 22 years of experience in the oil field with CARBO Ceramics, Schlumberger and Repsol YPF.
|
|
|
TERRY PALISCH is director of petroleum engineering for CARBO Ceramics in Irving, Texas. Prior to CARBO, Terry was employed by ARCO Oil and Gas. He earned a BS in petroleum engineering from the University of Missouri-Rolla in 1986.
|
|
|

