JANELL D. EDMAN, Edman Geochemical Consulting
Geochemical analysis of Eagle Ford oils from First Shot field illustrates how areas with higher thermal maturity have better-quality oils that are both easier to produce and less costly to refine.
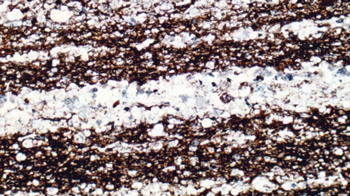 |
| Eagle Ford photomicrograph showing light laminae of foraminifera tests and dark laminae of clay and organic matter. The intervals enriched in foram tests are the better reservoirs. |
|
With the increasing discovery of shale oil plays, rock and fluid heterogeneities within these plays are becoming evident. In addition to variations in source facies, differences in thermal maturity over local areas are also responsible for some of the observed heterogeneities in fluid types. Therefore, accurate determination of local thermal maturity variations provides an inexpensive technique that can be used to high-grade acreage and determine where better quality oils that are easier to produce from tight reservoirs are likely to be found.
GEOLOGIC FRAMEWORK
The Eagle Ford is currently one of the most active shale plays in the United States.1 This Eagle Ford case history from the First Shot field area illustrates how thermal maturity impacts oil productivity and quality over relatively short distances. Much of the First Shot field is situated on the southwest flank of the San Marcos Arch2, Fig. 1. Another important local structural feature is the Karnes Fault Zone, which comprises a series of down-to-the-coast, listric normal faults.4,5 Regionally, the Eagle Ford Group disconformably overlies the Woodbine Group and is also overlain disconformably by the Austin Chalk.6-10 Much of the Eagle Ford Group is a mixed siliciclastic/carbonate unit (Fig. 2 and photo on this page) that records a second order, Late Cretaceous (Cenomanian to Turonian) transgression and highstand of eustatic sea level.7-10 Regional statigraphic correlations using electric logs indicate that most of the samples in this study are probably from the lower Eagle Ford (Fig. 3).
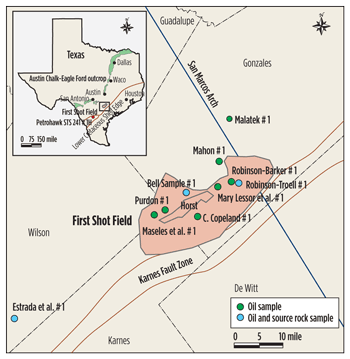 |
| Fig. 1. Location map showing the First Shot field area and geochemical sample locations. The location of the Lower Cretaceous Shelf Edge is after Galloway et al. (2000)3. |
|
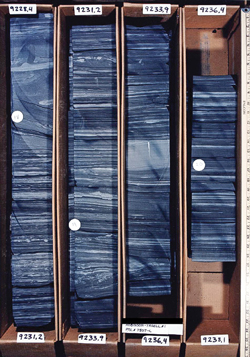 |
| Fig. 2. Slabbed Eagle Ford core from the Robinson-Troell #1 well. Yard-stick to the far right shows the scale. |
|
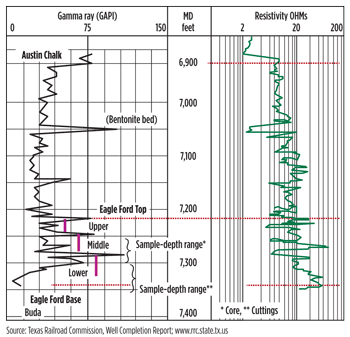 |
| Fig. 3. Diagrammatic electric log for the Bell Sample #1 well showing gamma ray depth, and resistivity for the Eagle Ford. The samples in this study are mostly from the lower Eagle Ford. |
|
GEOCHEMICAL ANALYSES
The locations of the wells from which rock and oil samples were taken for this study are shown in Fig. 1. Total organic carbon (TOC) was measured on 46 Eagle Ford rock samples. Samples with TOC contents of 1% or greater were analyzed by Rock-Eval pyrolysis.11 Results of the TOC and Rock-Eval pyrolysis analyses were used to select rock samples for solvent extraction and vitrinite reflectance analyses. Thirteen Eagle Ford oil samples were submitted for API gravity and weight percent sulfur determination. Liquid chromatography was used to separate the oils and source rock extracts into fractions. The extract and oil saturate fractions were then further analyzed by gas chromatography (GC) and biomarker (GCMS/MS) analyses.
GEOCHEMICAL MATURITY
Most geochemical parameters are a function of both the organic matter (kerogen) composition and the thermal maturity level of the organic matter, when it generated hydrocarbons.12,13 As a source rock generates and expels hydrocarbons, measureable changes occur in both the source rocks and the hydrocarbons generated. For example, TOC14 and S2 values15 both decrease with increasing thermal maturity. Such changes in geochemical parameters, with increasing hydrocarbon maturation, can be used to help determine whether the source rock for a shale oil play is immature, in the early oil window, at peak oil generation, in the late oil window, in the zone of condensate and wet gas generation, or in the dry gas window. In this investigation, over a distance of about 11 miles, the Eagle Ford extends from the early oil window to the late oil window—a change that has a marked impact on oil producibility and quality. Four different maturity parameters (Tmax, vitrinite reflectance, and gas chromatography and biomarker parameters) were used in this study to determine thermal maturity. For the best and most accurate maturity determinations, multiple thermal maturity parameters should be measured and compared, and any discrepancies in the maturity data should be resolved.
Tmax is a thermal maturity parameter derived from pyrolysis (heating) of ground source rocks.12,16,17,18 During pyrolysis, two hydrocarbon peaks are evolved: S1, the hydrocarbons already generated, and S2, the remaining hydrocarbon generating potential. Tmax is the oven temperature of the analytical instrument at which the maximum S2 yield is obtained, and it increases with increasing source rock maturity. The generic beginning and ending of the oil-generative window correspond approximately to Tmax values of 435°C and 470°C, respectively.16,18 A plot of Tmax vs. depth for the three wells with Eagle Ford source rock samples is shown in Fig. 4. Published guidelines18 for the average Tmax values indicate that the Eagle Ford is in the early oil window in Bell Sample #1, at peak oil generation in Estrada et al. #1, and in the late oil window in Robinson-Troell #1. There is a greater increase in thermal maturity relative to the increase in sample depth between the Robinson-Troell #1 core samples and the Estrada et al. #1 cuttings than there is between Estrada et al. #1 cuttings and the Bell Sample #1 samples.
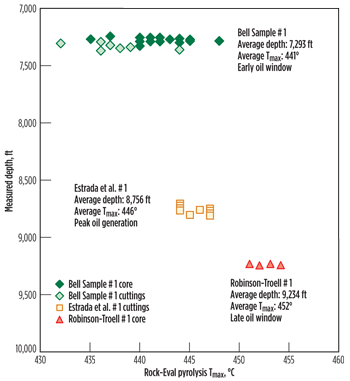 |
| Fig. 4. Tmax vs. depth for all three wells. The Tmax values rise with increasing sample depth, indicating the deeper samples are more thermally mature. |
|
Vitrinite reflectance (%Ro) is another thermal maturity parameter measured for this study, Table 1. All of the %Ro values are followed by a question mark indicating a high degree of uncertainty for these measurements. This uncertainty is typical of %Ro measurements for many shale oil plays because these shales were deposited in environments that commonly lack true vitrinite, which is derived from higher plant sources in rocks of Devonian and younger age. In addition, the measurement of vitrinite reflectance on dispersed organic matter in sedimentary rocks is notoriously subjective, because morphology alone is generally used to identify “true” vitrinite. While this may work for coals (%Ro was developed for coals), it does not work well for black shales that often contain a number of other organic constituents having vitritnite morphology but not vitrinite chemistry. If %Ro is measured on these other constituents, then the maturity determination may be either too high or too low. Using fluorescence in conjunction with reflectance provides a more objective means for identifying “true” vitrinite and is one way of circumventing the subjectivity problem.19
| Table 1. Vitrinite Reflectance Data |
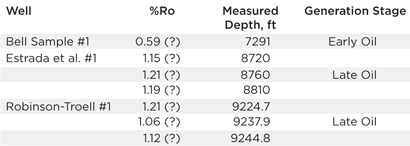 |
The %Ro measurements for the First Shot field samples indicate that the Eagle Ford may be in the early oil window in Bell Sample #1 and in the late oil window in the Estrada et al. #1 and Robinson-Troell #1 wells.20 Whereas Tmax data indicate that the Estrada et al. #1 Eagle Ford is at peak oil generation, the %Ro data suggest that these same samples are in the late oil window. Comparison of the Tmax and vitrinite data with gas chromatography and biomarker maturity parameters is needed to resolve this apparent disagreement in maturity data.
Gas chromatography (GC). The dominant influence of maturity on the oils and extracts in this study can also be observed in the GC data (Fig. 5), in which two GC thermal maturity parameters, pristane/nC17 and phytane/nC18, are cross plotted. Pristane and phytane are branched alkanes, and nC17 and nC18, are straight-chain alkanes. With increasing maturity, Pr/nC17 and Ph/nC18 both decrease.12,13 Therefore, the less mature oils plot in the upper right, and the more mature oils plot in the lower left. As is the case for Tmax (Fig. 4) and %Ro (Table 1) maturity parameters, the Bell Sample #1 Eagle Ford GC maturity parameters exhibit lower maturity, and the Robinson-Troell displays higher maturity. The R2 in Fig. 5 for the 13 Eagle Ford-sourced oils21 is 0.8032, indicating the oils in this plot have the same/similar source, and these data points plot along the same tie line, mostly according to thermal maturity variations occurring within oils generated from this same/similar source rock.
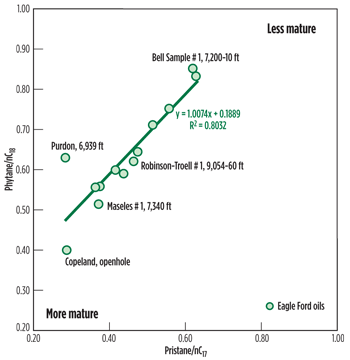 |
| Fig. 5. Gas chromatography maturity parameters phytane/nC18 vs. pristane/nC17 for 13 Eagle Ford oils from the First Shot field area. |
|
Biomarkers (GCMS/MS) are molecular fossils that can be used to provide information on both the maturity and source facies of rocks and oils. They are also among the most powerful “fingerprinting” tools available for determining whether various oils have the same or similar source rock for a particular oil. In this article, biomarkers are used primarily to determine the relative thermal maturity of oils and source rock extracts. For the seven source rock extracts evaluated for this paper, the oil saturation indices (OSI or S1x100/TOC) are all less than 100, indicating the Eagle Ford extracts are indigenous bitumen rather than migrated oil.22
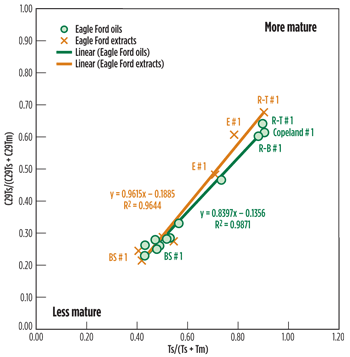 |
| Fig. 6. Terpane biomarker maturity parameters C29Ts/(C29Ts +C29Tm) vs. Ts/(Ts+Tm) for the 13 Eagle Ford oils and seven Eagle Ford source rock extracts from the First Shot field area. |
|
In Fig. 6, two biomarker parameters that are sensitive to changes in thermal maturity, (Ts/(Ts + Tm) and (C29Ts)/(C29Ts + C29Tm), are cross-plotted to show the relative thermal maturity of various oils and source rock extracts in this study. With increasing thermal maturity, Ts increases relative to Tm, and C29Ts increases relative to C29Tm.13 Thus, the less mature oils and extracts plot in the lower left, and the more mature oils and extracts plot in the upper right.
The linear regression line through these maturity-sensitive oil parameters has an R2 of 0.9871, and the R2 for the linear regression line through the source extracts is 0.9644. The high R2 values for these maturity-sensitive parameters, combined with the similarity of the slopes for the two linear regression lines (0.8397 and 0.9615, respectively) indicate the Eagle Ford oils and extracts have the same/similar source facies, and that the variations in where the data plot along the tie lines are largely the result of differences in thermal maturity. That is, the source rock extracts and oils from the Bell Sample #1 well tend to be the least thermally mature, the Robinson-Troell #1 oil and extract have among the highest thermal maturities, and the maturity of the Estrada et al. #1 extracts is intermediate between the Bell Sample #1 and the Robinson-Troell #1. These observations tend to support the Tmax maturity data (rather than the vitrinite reflectance data) in indicating the Estrada et al. #1 Eagle Ford is more likely to be at peak oil generation as opposed to being in the late oil window. Finally, in showing that the source rock extracts and oils from the same wells have comparable thermal maturities and the same/similar source facies, Fig. 6 indicates most of the Eagle Ford oils at First Shot field were locally sourced.
To summarize, four different geochemical maturity parameters generally indicate that, of the three wells in this study with rock samples, the Eagle Ford is in the early oil window in the Bell Sample #1 well, at peak oil generation in the Estrada et al. #1 well, and in the late oil window in the Robinson-Troell #1 well. Note that Bell Sample #1 and Robinson-Troell #1 are only 11 miles apart. Yet, there is a significant maturity difference between these two wells.
MATURITY EFFECTS
Effect of maturity on rock geochemical measurements. Geochemical measurements represent the present-day values of the various geochemical parameters. If the source rocks are mature and have already generated and expelled hydrocarbons, then the present-day values for such parameters as TOC and S2 are residual values and will be lower than the initial/original TOC14 and S215 values. The plots of S2 vs. TOC shown in Figs. 7 and 8 can thus be regarded as present-day “snapshots” of what the current hydrocarbon-generating capacity and kerogen types are. These two plots do not show the original TOC and S2 values.
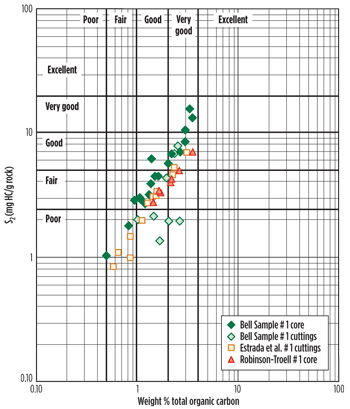 |
| Fig. 7. Log-log cross plot of Eagle Ford S2 vs. TOC data. Interpretive data fields are from Peters and Cassa (1994).18 |
|
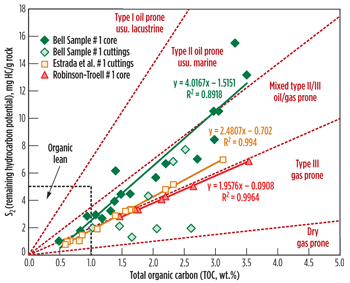 |
| Fig. 8. Linear-linear plot of S2 vs. TOC for the Eagle Ford source rock samples. Plot modified from Geochemistry Services Group at Weatherford Labs. |
|
For both of these plots, the S2 values typically tend to be higher for the lower maturity samples (Bell Sample #1) and lower for the higher maturity samples (Robinson-Troell #1). The TOC values for the Bell Sample #1 core samples and the Robinson-Troell #1 core samples do not exhibit as much variation as the S2 values. This may be because of organic facies and kinetics variations between the Eagle Ford in these two wells. Therefore, the overall progressive decrease in Eagle Ford S2 values shown in Fig. 7 and 8 between Bell Sample #1, Estrada et al. #1, and Robinson-Troell #1 wells is interpreted to be due mostly to the respective increase in maturity for these three sample sets. Similarly, the apparent change in Eagle Ford organic matter (kerogen) type from Type II in the Bell Sample #1 core to mixed Type II/III in Estrada et al. #1, to Type III in Robinson-Troell #1, shown in Fig. 8, is also likely to be the result of Eagle Ford maturity differences between these three wells, rather than to actual changes from originally oil-prone to originally gas-prone kerogen.
Effect of maturity on oil geochemical measurements. The effect of increases in source rock thermal maturity on the First Shot oils is illustrated in Fig. 9, which is a cross plot of weight percent sulfur (%S) vs. API gravity. With increasing thermal maturity, the weight %S in oils generated from the same/similar source rock decreases, and the API gravity increases.12 Therefore, Fig. 9 can also be used to determine relative thermal maturity of the First Shot oils. Although the R2 for the linear regression line through all 13 oils is only 0.5641, by removing two outlier data points from this plot (the Maseles et al. #1 7,296 ft and 7,340 ft oils), the R2 increases to 0.8898. The observation that these 11 oils all fall on the same tie line with an R2 of 0.8898 is interpreted as indicating these oils were probably generated from the same/similar source facies but at different levels of thermal maturity. Specifically, the lowest maturity oil generated from this common source facies is from the Bell Sample #1 well, and the most mature oil generated when this same/similar source facies was more mature is the C. Copeland #1 open hole oil. Other high-maturity oils in this plot are from the Robinson-Troell #1 and Robinson-Barker #1 wells.
Fig. 9 also shows seven of these 13 Eagle Ford oils have sulfur contents greater than 1%, and an eighth oil has a sulfur content of 0.99%. Oils with greater than 1% sulfur are classified as high-sulfur oils. Therefore, most of the oils in this study are high-sulfur oils. Furthermore, high-sulfur oils are typically generated from high-sulfur organic matter,23 so most of the First Shot field Eagle Ford oils were generated from a source facies variant within the Eagle Ford that has elevated sulfur contents. A number of investigators23-26 have proposed that high-sulfur kerogens start to generate oil at lower thermal maturity levels. Therefore, the higher-sulfur kerogen that generated the high sulfur oils in the First Shot field area may have begun to generate oil at lower thermal maturity levels than would be anticipated for more typical Type II kerogens. Failure to recognize the possibility of early generation for these oils might lead a company to overlook or downgrade an area where this facies of the Eagle Ford has already begun generating oil, even though the %Ro is <0.6 (the assumed generic onset of oil generation).
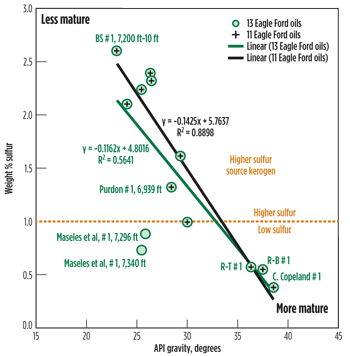 |
| Fig. 9. Weight percent sulfur vs. API gravity for the Eagle Ford oils in the First Shot field area. |
|
However, the variations in %S and API gravity have significant economic consequences for the First Shot Eagle Ford oils. First, the high-sulfur, low-gravity oils are likely to be more viscous and more difficult to produce from low-permeability, low-porosity reservoirs. Second, high-sulfur oils are more expensive to refine, and the producer may have to pay a penalty for higher sulfur Eagle Ford oils. Ideally, companies should look for higher maturity “sweet spots”, where better quality oils (such as the Robinson-Troell #1 oil with a gravity of 36.3° and 0.57 %S) are more likely to be found. Delineating such “maturity sweet spots” can be done by using a number of low-cost geochemical maturity measurements to obtain the most accurate consensus of true maturity.
One question remains to be answered. Why is the maturity for Robinson-Troell #1 so much higher than for Bell Sample #1 well (Fig. 4), when these wells are only 11 miles apart (Fig. 1)? Modeling shows that differences in burial depth, alone, cannot account for the maturity differences. Instead, one needs to call on variations in the thermal history.27 One potential cause for the elevated Robinson-Troell #1 thermal history is hydrothermal activity, which has been mentioned in the literature as a possibility, and there is specific evidence for hydrothermal activity in the First Shot field.4 These hydrothermal fluids could have migrated up the Karnes Fault Zone (Fig. 1) and elevated the maturity of the Eagle Ford in the Robinson-Troell #1 well.
CONCLUSIONS
-
Maturity levels of the Eagle Ford in the First Shot field area range from the early oil window to the late oil window. Consequently, even in this relatively local area, the producibility, physical properties, and value of the Eagle Ford oils also vary as maturity changes within the field.
-
In general, the lower-maturity Eagle Ford oils at First Shot field tend to have higher sulfur content, lower gravity values and are more viscous. Such properties make these low-maturity oils more difficult to produce from low-permeability rocks and more costly to refine. In contrast, the higher-maturity Eagle Ford oils have much lower sulfur contents, higher gravities, and are less viscous, making them easier to produce from tight reservoirs and less costly to refine.
-
Accurate determination of thermal maturity by various geochemical measurements provides a low-cost means of high-grading acreage and determining where the better-quality and more easily produced oils are more likely to occur. This technology can be applied easily and inexpensively to other shale oil plays. 
ACKNOWLEDGMENTS
Thanks go to Jane Newman, Mike Uland, Ann Givan, Nancy Ash-Shofner and Laura Wray for reviewing an earlier version of this article. Their comments and suggestions are greatly appreciated and considerably improved the final version. Janet Pitman was the co-author of the GCAGS publication, from which information was obtained for this article.
GCAGS REPUBLICATION PERMISSION
Figs. 1, 3, 6-9 are republished by permission of the Gulf Coast Association of Geological Societies, whose permission is required for further publication use.
LITERATURE CITED
1. Durham, L. S., 2010, “Eagle Ford joins shale elite,” AAPG Explorer, Jan. 2010, p 20 and 24.
2. Culotta, R., T. Latham, M. Sydow, J. Oliver, L. Brown and S. Kaufman, 1992, “Deep structure of the Texas Gulf passive margin and its Ouachita-Precambrian basement: results from COCORP San Marcos Arch survey,” AAPG Bulletin, v. 76, pp 270-283.
3. Galloway, W. E., P. E. Ganey-Curry, X. Li and R. T. Buffler, 2000, “Cenozoic depositional history of the Gulf of Mexico basin”, AAPG Bulletin, v. 84, pp 1743-1774.
4. Corbett, K. P., J. D. Edman, and E. M. Hundley-Goff, 1994, “Mechanics of fracturing and faulting in the Austin Chalk - evidence for natural hydrofracturing from the First Shot field, Texas, in Exploration and production from chalk reservoirs – worldwide,” EAPG/AAPG Special Conference on Chalk, extended abstracts book, Copenhagen, Denmark, Sept. 7-9, 1994, pp 40-43.
5. Corbett, K. P., D. Van Alstine, and J. D. Edman, 1997, “Stratigraphic controls on fracture distribution in the Austin Chalk: an example from the First Shot field, Gonzales Co., Texas” (abs.), AAPG Hedberg Conference, Reservoir scale deformation -- characterization and prediction, June 22-28, Bryce, Utah.
6. Surles, M. A., 1987, “Stratigraphy of the Eagle Ford Group (Upper Cretaceous) and its source-rock potential in the East Texas Basin,” Baylor Geological Studies Bulletin, No. 45, p 57.
7. Liro, L. M., W. C. Dawson, B. J. Katz, and V. D. Robison, 1994, “Sequence stratigraphic elements and geochemical variability within a ‘condensed section’,” Eagle Ford Group, east-central Texas: Gulf Coast Association of Geological Societies Transactions, v. 44, pp 393-402.
8. Robison, C. R., 1997, “Hydrocarbon source rock variability within the Austin Chalk and Eagle Ford Shale (Upper Cretaceous), East Texas,” International Journal of Coal Geology, v. 34, pp 287-305.
9. Dawson, W. C., 1997, “Limestone microfacies and sequence stratigraphy: Eagle Ford Group (Cenomanian-Turonian) north-central Texas outcrops,” Gulf Coast Association of Geological Societies Transactions, v. 47, pp. 99-105.
10. Dawson, W. C., 2000, “Shale microfacies: Eagle Ford Group (Cenomanian-Turonian) north central Texas outcrops and subsurface equivalents,” Gulf Coast Association of Geological Societies Transactions, v. 50, pp 607-622.
11. Espitalie, J., J. L. Laporte, M. Madec, F. Marquis, P. LePlat, J. Paulet, and A. Boutefeu, 1977a, “Rapid method of characterizing the petroleum potential and degree of evolution of source rocks,” Revue l’Institute Francais du Petrole, v. 32, pp 23-42.
12. Waples, D. W., 1985, Geochemistry in petroleum exploration, Boston, International Human Resources Development Corporation, p 232
13. Peters, K. E., C. C. Walters, and J. M. Moldowan, 2005, The biomarker guide, volumes 1 and 2: Cambridge, Cambridge University Press, p 1155
14. Daly, A. R., and J. D. Edman, 1987, “Loss of organic carbon from source rocks during thermal maturation” (abs.), AAPG Bulletin, v. 71, p 546.
15. Espitalie, J., M. Madec, B. Tissot, J. J. Mennig, and P. Leplat, 1977b, “Source rock characterization method for petroleum exploration,” Proceedings of the 9th Annual Offshore Technology Conference, v. 3, pp 439–448.
16. Peters, K. E., 1986, “Guidelines for evaluating petroleum source rock using programmed pyrolysis,” AAPG Bulletin, v. 70, p. 318–329.
17. Jarvie, D. M., 1991, “Total organic carbon (TOC) analysis,” in R. K. Merrill, ed., Source and migration processes and evaluation techniques, AAPG Treatise of Petroleum Geology, Handbook of Petroleum Geology, pp 113–118.
18. Peters, K. E., and M. R. Cassa, 1994, Applied source rock geochemistry, L. B. Magoon and W. G. Dow, eds., “The petroleum system – from source to trap,” AAPG Memoir 60, pp 93-120.
19. Newman, J., K., M. Eckersley, D. A. Francis, and N. A. Moore, 2000, “Application of vitrinite-inertinite reflectance and fluorescence to maturity assessment in the East Coast and Canterbury Basins of New Zealand,” New Zealand Petroleum Conference Proceedings, pp 314-333.
20. Dembicki Jr., H., 2009, “Three common source rock evaluation errors made by geologists during prospect or play appraisals,” AAPG Bulletin, v. 93, pp 341-356.
21. Edman, J. D., 1994, “Application of geochemistry to exploration in the Austin Chalk, First Shot field, Gonzales County, Texas” (abs.), AAPG Annual Meeting, Denver, Colorado June 12-15, 1994.
22. Jarvie, D. M., R. J. Coskey, M. S. Johnson, and J. E. Leonard, 2011, “The geology and geochemistry of the Parshall area, Mountrail County, North Dakota,” in J. W. Robinson, J. A. LeFever, and S. B. Gaswirth eds., Bakken-Three Forks Petroleum System in the Williston Basin, pp 229-281.
23. Orr, W. L., and J. S. Sinninghe Damste, 1990, “Geochemistry of sulfur in petroleum systems,” in W. L. Orr and C. M. White, eds., Geochemistry of sulfur in fossil fuels, ACS Symposium Series 429, pp 2-29.
24. Tissot, B. P., and D. H., Welte, 1984, Petroleum formation and occurrence (second edition): Berlin, Springer-Verlag, p. 699.
25. Peters, K. E., J. M. Moldowan, and P. Sundararaman, 1990, “Effects of hydrous pyrolysis on biomarker thermal maturity parameters: Monterey phosphatic and siliceous members,” Organic Geochemistry, v. 15, pp 249-65.
26. Baskin, D. K., and K. E. Peters, 1992, “Early generation characteristics of a sulfur-rich Monterey kerogen”, AAPG Bulletin, v. 76, pp 1-13.
27. Edman, J. D., and J. K. Pitman, 2010, “Geochemistry of Eagle Ford Group source rocks and oils from the First Shot field area, Texas,” Gulf Coast Association of Geological Societies Transactions, v. 60, pp 217-234.
|
AUTHOR
|
 |
JANELL EDMAN is an industry recognized expert in interpreting oil, gas and source rock geochemical data. Dr. Edman has BS and MS degrees in geophysics from Stanford University and a Ph.D. in geology from the University of Wyoming. She has over 25 years of industry experience in both domestic and international exploration and production, including 10 years at Marathon's Petroleum Technology Center, over 10 years as a consulting geochemist, and five years of prospect generation work at Mobil. |
|
|


