B. DOW, R. HARMER and J. BELASKIE, Schlumberger
 |
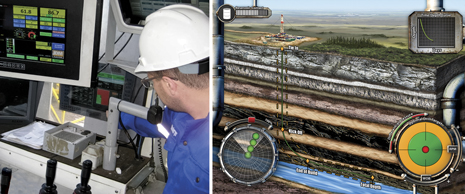
| Driller interacts with the Performance Advisory System rig floor display (left) with a close-up view of the drilling recommendations patterned after game applications. |
|
Successful well construction improvement requires a tool that delivers timely advice to the driller, enabling performance improvement without distracting from other priorities. A new technology is now available that allows data to be turned into actions at the wellsite, improving overall well construction performance. The development team applied a rich understanding of existing wellsite workflows and incorporated technology, workplace ergonomics, and key attributes from gaming and telecommunications industries. The end result is an application that brings together several performance improvement analytical tools into one console, turning data into clear directions for the driller, and delivering immediate performance improvement. Field data from 10 wells throughout the world show how the system has been used to reduce well construction time by more than 20%.
DRILLING PLANNING & EXECUTION
The planning phase of a well typically involves a process, which identifies and attempts to mitigate key risks. Analysis of offset well data, modeling tools, and knowledge of the specifications of the drilling equipment allow the drilling engineering team to define a set of typical drilling operational limits on a per-hole section and per-formation basis. This package of information is then passed to the rig site team as part of the drilling program, to be used within the execution phase.
During the execution phase, the rig site team has information available from a wide range of sources, including:
-
Surface and downhole measurements, which may, for example, be used to evaluate the efficiency of the drilling process, to identify drilling dysfunctions, and the risk to which the drilling equipment is being exposed at any given point in time (Staveley et al. 2010).
-
Real-time models of the drilling process, which enable modeled vs. actual comparisons with surface and/or downhole measurements, allowing early identification of deviations from expected trends (Reiber et al. 1999).
-
Analytical tools developed over years of research and development that consume real-time information and are able to generate drilling parameter recommendations.
This article focuses on the development and field application of a real-time performance advisory system designed to maximize the value of drilling operational boundaries, defined within the planning phase and real-time information (measurements and models). The system does this through the clear presentation of contextual information to help the rig site team answer questions and make decisions and, when appropriate, the provision of advice to the driller and directional driller on the rig floor.
INTEGRATED DRILLING IMPROVEMENT
Drilling optimization has arisen from the demands of operators to improve well construction efficiency and lower costs, but how it is deployed around the world is not consistent. For many operators, drilling optimization has typically been a consultancy service, which relies heavily on the talent of particular individuals involved in execution. Additionally, the resources required, including software, workflows, downhole hardware, etc., vary considerably from project to project.
To achieve consistent, efficient well construction, it is essential to leverage the strengths of the drilling engineering team—which analyzes offset and follows engineering standards and guidelines to develop the well plan—the rig site team, and those supporting the drilling process in real time, potentially from Operations Support Centers (OSC). The generation of a Performance Drilling Plan (PDP) is a valuable tool to assist this process. Figure 1 summarizes the role of the Drilling Engineering Center, rig site team and remote OSC in the drilling optimization workflow.
 |
| Fig. 1. The real-time performance advisory system maximizes the value of drilling operational boundaries through the clear presentation of contextual information to help the rig site team improve drilling performance. |
|
The PDP is developed by the drilling engineering team, including input from geomechanics experts when appropriate, in the planning phase and is designed to provide the rig site and OSC-based drilling team with a comprehensive understanding of drilling hazards, performance boundaries and operational recommendations aimed at maximizing well delivery. The PDP is a key input into the performance advisory system described within this paper, and includes:
-
Performance boundaries (definition of a “safe operating envelope”)
-
Drilling operational limits (typically defined in terms of WOB, RPM, torque and ROP/ECD) on a per-bit run, per-performation basis. These limits consider surface and downhole equipment limitations, results from drilling engineering models (torque and drag, hydraulics, vibrations) and offset well experience.
-
Trip schedules to mitigate risks associated with swab/surge, formation hazards and problem zones.
-
Risks identified from the analysis of offset wells and a summary of the mitigative actions that have been put in place
-
Key performance indicators to help the team benchmark their performance in real time against the target performance, e.g., connection times, target number of bit runs per hole section, on-bottom ROP.
-
Operational recommendations
-
For example: Short trip schedules, shock and vibration mitigation workflows
-
Tripping plans to mitigate the risk of stuck pipe
-
Lithology map that will help identify transition zones and preserve bit life
Depending on the complexity of the well, the list can be much longer. Once the PDP is built, it is maintained as a living guide for the execution team through the drilling of the well. Through close monitoring of the drilling progress, the execution team will be able to monitor success and capture deviations from plan quickly so mitigation strategies, either pre-determined or re-engineered, are executed as soon as possible to prevent lost time.
Utilizing technology to pass key information from the PDP and provide key answers to the rig team, as and when required, will result in improved execution of recommendations, provided the answers are correct, timely and contextual. Once the well is complete, a post-drill assessment of the workflows and execution results relative to the plan must be performed, just as in any post-well review. By comparing actual well performance with the prediction, including KPIs, lessons learned and recommendations are captured for the next well and the performance process continues. Performance improvement through workflows similar to the PDP is the goal of most drilling teams. Several operators and many service providers may have something similar, either formal or informal. The challenge is ensuring that the data derived while preparing and then executing the workflow can be applied in a timely manner. The performance advisory system described here supports this process.
PERFORMANCE ADVISORY SYSTEM
The Performance Advisory System has three key aspects:
-
The ability to incorporate key information from the PDP and help maximize the value of this information during the execution phase.
-
The capability to receive outputs from drilling process models and quick-event-detection algorithms (Aldred et al. 2008), pass advised drilling parameters to maximize ROP and avoid NPT through early identification of deviations from expected trends.
-
The ability to present visually appealing, contextually specific displays to clearly convey appropriate information and recommendations to the driller on the rig floor.
The system is designed to allow rapid modification of the real-time drilling screens based on field feedback. Each of the real-time screens is constructed from a number of elements, making it possible to completely reconfigure a screen and re-deploy it to the field with a turnaround time of less than one hour. As experience is gained and the optimum screen configurations are identified by field users, these screens are then incorporated as additional standard screens within the rig site acquisition system.
Maximizing the value of the planning phase. It is common practice to identify risks during the planning phase of a well, potentially within systems that allow visualization of risks in a geological context vs. drilling information (Telford et al. 2004). Modifications are made to the well design, and technologies selected for use within the well construction process, to mitigate these risks. However, it is normal for risks to remain, and there is clear value to these risks being displayed at appropriate times on the rig floor. The system allows the user to select a subset of the risks defined for the well that are appropriate to display during the upcoming bit run. As drilling commences, the risks are displayed as the bit approaches the depth of concern.
A wide variety of limits (static, a function of measured depth or the real-time output from a model) defined for a bit run during the planning phase can be entered into the system for use in the execution phase. The limits are continuously converted, in real time, into the parameter space that can be controlled by the driller or automation system. In the case of ROP optimization, for example, the limits are mapped to WOB/RPM/flowrate space to create a “safe operating envelope,” allowing the safe maximization of ROP without exceeding the capabilities of the drilling system.
User-defined functions and real-time models. Robust, continuously calibrated real-time models allow “at a glance” modeled vs. actual comparisons of key parameters, such as ECD, standpipe pressure, surface torque and hook load. These parameters assist the drilling team in the early identification of problems during drilling, tripping, reaming and casing running operations, especially for the detection of slowly developing trends that are difficult to discern from the rig floor instruments, alone. The outputs from quick, event-detection algorithms, such as a washout detector, can be displayed as well.
The system was designed to perform simple user-defined functions, which can be powerful for identifying deviations from expected trends; for example, via the computation of an overpull during tripping operations or a SWOB-DWOB to identify weight transfer issues while sliding or rotary drilling. Threshold levels can be defined for surface and downhole measurements, allowing risks to be clearly displayed on the rig floor via a traffic light system.
Real-time display technology. Rig floor screens for the Performance Advisory System incorporated input from ergonomics expertise, and considered approaches used by the video game and mobile phone applications. A range of screens was developed, grouped into the following areas;
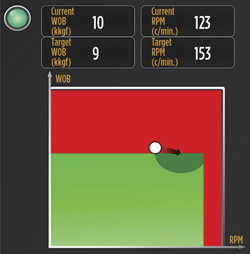
Feedback was obtained from field users on the clarity and visual appeal of the screens, with the ability to rapidly customize them to suit local environments. The system is able to provide “inform” or “advise” level services, depending upon inputs available. The use of a clear traffic light system for shock and vibration mitigation, and the display of operational boundaries, providing a “GPS for the driller,” as shown in Fig. 2, received positive feedback from rig site teams.
 |
| Fig. 2. A real-time screen of ROP optimization evaluated during the testing of the advisory system. |
|
To achieve the best possible drilling performance results with the system, a key requirement was the ability to combine large quantities of real-time data, with information from models (pre-drill and real-time) and the PDP (e.g., risks), to generate answers and drive recommendations at the rig floor. Delivery of the end results of these processed data needed to be clear and concise, so the actions could be followed quickly and effectively.
The driller and directional driller on the rig floor are the primary users of the system, so if recommendations are passed, they must be in terms of actions that can be made with the rig controls to improve performance or prevent incidents. The control console on a drilling rig has never been simple to manage, and as rigs become more capable with technology evolution, the dog house control console continues to grow in complexity. To have an effective impact on performance without distracting the driller from a wide range of drilling consoles meant the system displays need to be clear and easy to follow.
The development team capitalized on a unique opportunity to develop and introduce a control system display that was new to oilfield display consoles. Through collaboration with another project group developing an iPAD game for use to showcase new directional drilling technology, the team worked closely with a software development group specialized in gaming and mobile device apps. The goal was to develop a new control console concept that could:
-
Be understood instinctively and quickly
-
Merge multiple recommendations into a single, simple output
-
Be visually compelling to capture user attention
The main control screen is shown on page 39. The rosebud on the left is used to control the toolface for a rotary steerable system (RSS) or a motor. The unique feature here is a merged display that is independent of the steering BHA type. Historically, a motor steering rosebud is underutilized real estate in front of the driller, because steering commonly happens sporadically across the overall drilling time. The rosebud on the right focuses on ROP optimization. Rather than directing the driller to maintain a target WOB and RPM number, the representation is relative to previous set points, and the goal then becomes maintaining a lock on the bullseye. This way, constant pursuit of optimum WOB and RPM occurs, much like a continuous drill-off test.
Furthermore, the impact of shock and vibration (S&V) will cause the ball to fall out of target parameters and the driller will then be directed to re-adjust parameters to remove the S&V effect and return to optimum drilling parameters. Effectively, RPM, WOB and S&V management are all merged into a single advisor to allow the driller to maximize ROP. Behind the scenes, the limits that guide each variable are managed by the processing algorithms.
CASE STUDIES
The Performance Advisory System was used on several wells, including the three wells presented as case histories here.
ROP optimization in Russia with drilling parameter recommendations. The system was used to convey drilling parameter recommendations to the rig floor (a “GPS” for the driller) within a field with good offset well information. The drilling parameter recommendations were generated by an ROP optimization application (Dunlop et al. 2011) containing a Detournay model (Detournay et al. 2002) of the cutting action of a PDC bit and change point technology to continually fit the model to real-time drilling data. Contours of ROP computed, based on the bit model, are combined with user input constraints (engineered limits), allowing real-time identification of the optimum parameters (surface WOB and surface RPM) to maximize ROP within the specified “safe operating envelope.” Use of the application, without modification to the drilling technology/drive system, resulted in a 27% increase in on-bottom ROP vs. the field average and improvement in the time-depth curve across which the system was used vs. the closest offset well.
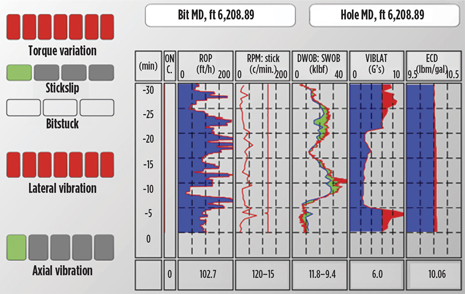
Mitigating S&V for a North Sea well. A vertical 26-in. hole section was drilled through a chert-contaminated chalk formation, which generated varying levels of vibrations throughout the bit run. The traffic light color-coded screen made it easier for the Driller to monitor the vibration severity and promptly act to mitigate the damaging drilling dysfunction. The recommendations displayed on the rig floor allowed the driller to take action and mitigate accordingly, Fig. 3.
 |
| Fig. 3. Communication of the severity of the downhole shock and vibration environment |
|
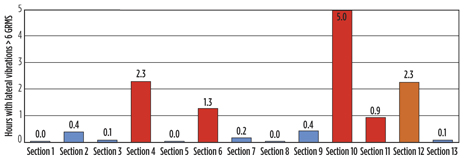
S&V mitigation for a deepwater Brazil well. A number of drillsting failures had occurred, due to large bending moments and high rates of fatigue induced by the backwards whirl when drilling challenging vertical 17½-in. sections in a deepwater field. Figure 4 highlights a clear correlation between cumulative hours with severe downhole vibration levels (> 6 GRMS) and runs with drillstring failures (red), runs with downhole tool failures (orange) and runs where no drillstring integrity-related problems were experienced (blue).
 |
| Fig. 4. Chart highlighting the clear correlation between cumulative hours with severe downhole vibration levels (> 6 GRMS) and 17½-in. section runs with drillstring failures (red), downhole tool failures (orange) and runs where no drillstring integrity related problems were experienced (blue). |
|
In conjunction with modifications to the BHA design and drilling procedures, clear real-time screens were tested to help the team to understand downhole conditions. A significant reduction in the number of drillstring failures occurred during the drilling of subsequent 17½-in. hole sections. Rig floor screens helped the driller and directional driller clearly understand the rapidly changing state between moderate stick-slip to a fully developed backwards whirl system.
CONCLUSIONS
Optimizing the drilling process requires integration of vast quantities of data from various sources. Development of the Performance Advisory System has provided a technology capable of integrating several of these data sources to deliver sound advice and compel users to take actions to improve drilling. The technology platform for the system allowed initial field testing of the various success factors and helped the development team to rapidly evolve the system, further improving the impact at the wellsite. 
LITERATURE CITED
1. Telford, C., M. Burns and N. Whitley, “3D visualization: A common language for the drilling and subsurface communities,” SPE paper 90659, SPE Annual Technical Conference, Houston, Texas, Sept. 26-29, 2004.
2. Steveley, C. and P. Thow, “Increasing drilling efficiencies through improved collaboration and analysis of real-time and historical drilling data,” SPE paper 128722, SPE Intelligent Energy Conference and Exhibition, Utrecht, The Netherlands, March 23-25, 2010.
3. Reiber, F., B. Vosa and S. Eide, “On-line torque and drag: A real-time drilling performance optimization tool,” SPE paper 52836, SPE/IADC Drilling Conference, Amsterdam, Netherlands, March 9-11, 1999.
4. Clayton, R., E. Detournay, M. Fear, O. Matthews, B. Miller and T. Richard, “Influence of bit-rock interaction on stick-slip vibrations of PDC bits,” SPE paper 77616, SPE/IADC Drilling Conference, Texas, Sept. 29-Oct 2., 2002.
5. Aldred, W., R. Hutton, C. Luppens and G. Ritchie, “Development and testing of a rig-based quick event detection system to mitigate drilling risks,” SPE paper 111757, IADC/SPE Drilling Conference, Orlando, Florida, U.S.A., March 4-6, 2008.
6. Dunlop, J., R. Isangulov, W. Aldread, H. Sanchez, J. Flores, J. Alcaron, J. Belaskie and C. Luppens, “Increased rate of penetration through automation,”SPE paper 13989, IADC/SPE Drilling Conference, Amsterdam, The Netherlands, March 1-3, 2011.
|
AUTHORS
|
| BLAINE DOW joined Schlumberger as a field engineer after graduating with a B.Sc. in Civil Engineering from the University of New Brunswick in 1993. After an extensive field career in directional drilling in western Canada, offshore eastern Canada and the North Sea, he continued to expand his focus to all drilling performance and optimization technologies across various jobs at Schlumberger. In 2011, he joined the Dynamic Pressure Management segment as global Drilling Engineering Manager. Since 2008, he has been a member of the SPE/IADC technical committee for the annual global Drilling Conference. |
|
| RICHARD HARMER is the drilling performance product champion for Schlumberger Drilling & Measurements. His role focuses on marketing and leading the development of products related to drilling mechanics and dynamics and ROP Optimization. Prior to this role, Harmer provided worldwide InTouch support for drilling. He has 11 years of experience with Schlumberger, starting as an MWD and LWD engineer in Alaska before spending over five years as a rig site-based drilling optimization engineer on a wide array of projects. Mr. Harmer received a MS degree in mechanical engineering from the University of Loughborough. |
|
| JIM BELASKIE graduated with a BASc. in Mechanical Engineering from the University of Toronto in 1983 and joined Schlumberger as a field engineer. He worked in field operations for 10 years, research for three years and the remainder of his 29-year career in the engineering discipline, focusing on drilling mechanics models and software applications. |
|


