ALFREDO SANCHEZ and STEVE GIORDANO, Top-Co Inc.; NEVIO MORONI and CLAUDIO MOLASCHI, Eni E&P Division
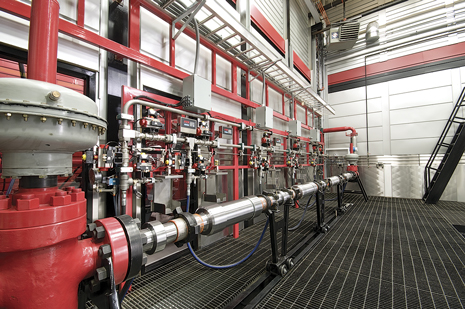 |
| The Edmonton flow loop facility was used to test the quality and reliability of casing float equipment under demanding conditions. |
|
The drilling industry has continued to stretch the boundaries of technology with the more challenging wells being drilled today. With mounting pressure from depressed hydrocarbon prices, particularly gas, as well as environmental concerns, this trend is expected to continue and even accelerate. When equipment is subjected to conditions that are close to its limit, quality and reliability are of paramount importance.
This article describes the combined efforts of an operator and a manufacturer to respond to some of these challenges, and the application of state-of-the art technology in mature and avant-garde testing practices, to ensure quality and reliability under more demanding conditions. The authors also identify other drilling challenges, such as equivalent circulating density, that are becoming ever more critical and yet lack comprehensive research, and propose ways to study these obstacles.
CASING FLOAT EQUIPMENT
API Recommended Practice 10F describes testing for casing float equipment.1 While the document describes testing conditions that accurately represent many real applications, some of the more challenging wells being drilled today require drilling practices that will significantly exceed these conditions.
For example, an operator was concerned about the durability and reliability of the auto-fill mechanism of auto-fill float equipment. Specifically, they believed, depending on casing running speeds, that the flow of displaced mud into the casing could have a negative impact on its performance. This was a particular concern in harsh environments, where high pressure, high temperature, and the presence of non-aqueous fluids create high-stress conditions for the equipment. Three potential failure mechanisms were identified:
• Difficulties or even failure to convert the valve after getting to bottom.
• Erosion of the valve’s plunger leading to difficulties circulating through
the valve.
• Erosion of the valve’s seal, leading to inability to hold back pressure.
• Any of the foregoing issues would compromise the success and
economics of the cement job.
The operator was of the opinion that back-pressure and flow duration could significantly exceed the conditions described and negatively impact performance of the float equipment. Additionally, API RP 10F does not involve measurement of pressure drop across the valve in either direction. A common procedure to calculate surge and swab pressures involves assuming a pressure drop across the valve, or simply ignoring it. The manufacturer and operator discussed the application and agreed to conduct a test that would simulate specific well conditions. The test was conducted at the manufacturer’s new flow loop facility, designed specifically to test float equipment in accordance with API RP 10F, but with significant flexibility to exceed those conditions.
Facility description. Figure 1 shows the flow loop’s tank and pumps.
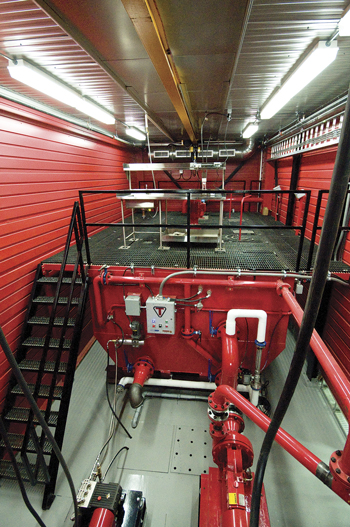 |
| Fig. 1. Mud tank and pumps. |
|
A drilling mud tank is used to store approximately 160 bbl of drilling mud. The mud system was a water-based mud, consisting mainly of barite and bentonite, and with rheological properties according to API RP10F:
Density: 12–12.5 lb/gal
Plastic viscosity: 10–50 cp
Yield point: 5–25 lb/100 ft2
10-s gel strength: >4 lb/100 ft2
Sand content: 2–4% by volume of 70/200 mesh sand
Of particular relevance to this test is the required sand content. Although the specified sand content may seem high, it is certainly possible, depending on the type of formation drilled and the efficiency of surface equipment. This amount of sand passing at high particle velocities through the small auto-fill opening in the valve creates significant amounts of wear that can hinder the valve’s performance.
Figure 1 also shows the facility’s high-pressure/low-flowrate positive displacement pump (left) and the high-flowrate/low-pressure centrifugal pump (right). Although the maximum flowrate indicated in API RP 10F is 10 bpm, additional capacity was built into the facility to be able to test at up to 22 bpm. It should be kept in mind that 65%–70% of the wells being drilled or planned today in North America are highly deviated or horizontal. These types of wells have significantly higher flowrate requirements for appropriate hole cleaning. The high-pressure pump is used to pressurize the system up to 5,000 psi. Both pumps are controlled with variable frequency drives, which react to the flowmeter’s continuous measurements to control and maintain flowrate.
Figure 2 shows the facility’s test bench, where up to four float collars or test pieces can be tested simultaneously. The capability to concurrently test multiple pieces has proved to be a major advantage in conducting extensive testing, and providing full understanding of equipment limitations and common failure modes, which can be addressed in the engineering design process. Furthermore, the test bench’s design allows for other types of equipment (in addition to float equipment) to be tested, such as stage cementing equipment, cement wiping plugs, etc.
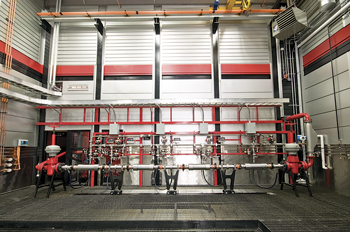 |
| Fig. 2. Test bench and flowmeter. |
|
The facility’s data-acquisition system records pressure, temperature and flowrate readings taken at different points of interest in the system, such as differential pressure across test pieces. There are 22 pressure reading locations that can be set to record at a user-defined sampling rate of up to 100 readings per second. This level of accuracy has proved to be fundamental in testing tools like cementing stage collars, where it is critical to record actual shifting pressures in a very short time.
The facility’s graphics-based control system (Fig. 3) allows most steps in a test to be conducted through the control software, requiring minimal intervention from the operator outside the control room and minimizing operator influence on test results. Flowrate, pressure and temperature readings are saved to raw data files, which are archived along with all other relevant information, such as manufacturing traceability paperwork, test photographs, etc.
Test procedure. The following test procedure was developed jointly by the operator and the manufacturer, to test the durability and reliability of the auto-fill mechanism of the float equipment in question:
• Install the cemented float valve, in auto-fill mode into the flow loop.
• Flow at 400 rpm for 5 min., and record the flowrate and pressure drop
across the valve.
• Increase to 800 rpm for 5 min., and record the flowrate and pressure
drop across the valve.
• Increase to 1,200 rpm for 5 min., and record the flowrate and pressure
drop across the valve.
• Increase to 1,600 rpm for 5 min., and record the flowrate and pressure
drop across the valve.
• Increase to 1,800 rpm and flow for 4.5 hr, and record the flowrate and
pressure drop across the valve.
• Remove fixture and inspect, then reverse the fixture and install back in
the flow loop.
• Flow at 10 bpm for 5 min. to convert from auto-fill to standard float
operation.
• Back-pressure the valve at 5,000 psi for 10 min.
• Remove the fixture from the flow loop, cut out the stabilizer and
inspect/document the condition of the seal.
• The specific objectives of this test procedure were:
• Measure pressure drop and flowrate across the valve at set, 400-rpm
increments.
• Measure erosion to the plunger and seal.
• Measure pressure application after back flow.
Test results. The valve was successfully flowed in reverse, in auto-fill mode, for 5.0 hr at 13.2 bpm (1,800 rpm), converted at 10 bpm flow, and held 5,000 psi back pressure for 10 min. after the test.
Figure 4 shows one of the flow graphs recorded during the test. The red line represents flowrate, while the green and blue lines represent the pressure before and after the valve, respectively. The graph shows two increments in flowrate and the corresponding increment in differential pressure, which can be easily appreciated to be a non-linear function of flowrate. Results illustrated the strength and reliability of the valve, and that it is fit for the specific service that the operator intended.
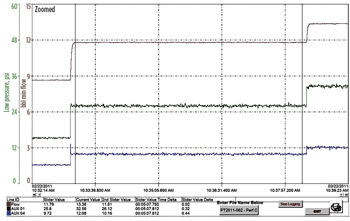 |
| Fig. 4. Reverse flow test. |
|
FURTHER RESEARCH
The test described is just one example of the need and benefits to develop and execute custom tests that better reflect the actual downhole conditions to which equipment will be subjected. This is particularly important in more challenging wells, where equipment is taken close to its physical limits.
Following is a description of additional research and testing areas that the authors believe have increasing importance in such wells.
Equivalent circulating density (ECD). Some 65%–70% of the wells being drilled or planned in North America are highly deviated or horizontal, with targets that require increasingly greater reach. This subject is more important than ever before, because ECD increases with reach, and cementing brings ECD closer to fracture pressure.
The benefits of casing centralization in mud removal and cement bond are well-documented. However, casing often does not get properly centralized, based on fears of being unable to get casing to bottom. This, in turn, can lead to compromises in the quality of the cement job. Often, the drilling engineer will make a decision on whether or not to centralize casing, based on torque and drag simulations, including buckling. If hook load is not expected to be an issue, optimum centralizers are installed. Sometimes, more than 250 centralizers are installed in the production string, but the effect of centralizers on ECD is seldom considered. Cementing simulators simply do not account for this effect. Little research on this subject has been published—it has concentrated on computational fluid dynamics simulations.2
The previously described facility was used recently to conduct flow loop experiments, to study this subject. Several types of casing centralizers were mounted on a joint of casing, and the assembly was installed inside a larger pipe, Fig. 5.
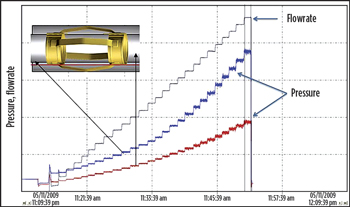 |
| Fig. 5. ECD test set-up. The graph is for illustration purposes only. |
|
Drilling mud was circulated through the created annular space, and the pressure drop across each centralizer was recorded, as the flowrate was increased. Preliminary tests showed that in some cases, the pressure drop can be as high as 1.0–1.5 psi per centralizer, which would coincide with the CFD simulations referenced above. Although these results are only a rough approximation based on preliminary tests, they do show the importance of further research. For example, a large number of centralizers installed in the production string could contribute over 200 psi to the equivalent circulating density. This could be a significant factor in formations with a tight pore pressure-to-fracture pressure window that could impact the cementing program.
A complete testing matrix required for a comprehensive study of this subject would be extensive. Accordingly, the authors believe that a joint industry project should be considered.
Lost circulation material (LCM). The use of LCM in drilling mud, and in cementing, is a very common practice. However, larger concentrations of LCM can lead to malfunctioning of float equipment. At the very least, LCM can prevent float equipment from stopping back flow after cementing, leading to protracted delays on cement times. Furthermore, it is also possible for LCM to completely plug the float equipment. The tolerance of float equipment to LCM concentrations is not commonly studied. Although the large number of variables involved, and the complexity of the required test set-up, make this subject very difficult to study, the authors believe it is still worth considering and have plans to conduct preliminary tests later this year.
Outside tests. All equipment manufacturers have limited testing capabilities, independent of how extensive these may be. Operators and manufacturers can benefit significantly from extending their testing initiatives beyond the manufacturer’s facilities. Recently, an operator drilling in the Eagle Ford (not the co-author of this publication) was considering reduced friction centralizers to minimize drag, and improve the casing running and cementing operations. Because casing was going to be rotated while cementing, the operator was concerned about the integrity of the centralizers. Since such a test was beyond the manufacturer’s testing capabilities, a drilling bit test lab was used. Figure 6 shows the polymer centralizer being installed in a hole that had been pre-drilled in a rock slab.
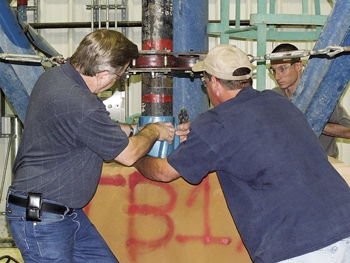 |
| Fig. 6. Centralizer wear test set-up. |
|
The hole was filled with 15-ppg mud, and a 5½-in. casing was installed inside the centralizer. A side force of 2,000 lb/ft was applied, and the casing rotated at 20 rpm. Wear on the centralizer was measured every 2 hr for 6 hr. Test results showed minimum wear on the centralizer and concluded that the product was fit for service. 
ACKNOWLEDGEMENT
The authors would like to thank Top-Co Inc., Eni E&P Division, and NOV Downhole for permission to publish this article.
LITERATURE CITED
1. API Recommended Practice 10F, Recommended Practice for Performance Testing of Cementing Float Equipment, third edition, April 2002.
2. Yao, D., and G. R. Samuel, “Annular pressure loss predictions for various stand-off devices,” IADC/SPE paper 112544, presented at the IADC/SPE Drilling Conference, Orlando, FL, March 4-6, 2008. http://dx/doi.org/10.2118/112544-MS
3. Nelson, E. B., and D. Guillot, Well Cementing, Second Edition, Schlumberger, 2006.
|
The authors
|
| ALFREDO SANCHEZ, PE, is Top-Co’s senior petroleum engineer, and is the author of several SPE papers and technical publications. He graduated from the University of Tulsa with a BS degree in mechanical engineering and an MS degree in petroleum engineering, with specific research in cuttings transport. Mr. Sanchez is a registered Professional Engineer in the State of Texas and in the Province of Alberta. |
|
| STEVE GIORDANO, C.E.T, is Top-Co’s senior engineering technologist, working as part of the Engineering Team, and operating Top-Co’s Flow Loop Test Facility. He is a Certified Engineering Technologist in the Province of Alberta. |
|
| NEVIO MORONI, is the cementing technical leader at Eni’s E&P Division. |
|
| CLAUDIO MOLASCHI, is the advisor drilling engineer at Eni’s E&P Division. |
|


