|
JOHAN MATTSSON, JONATHAN LINFOOT, DAVID PRICE, JOSTEIN LIMA, FOLKE ENGELMARK and CHRIS ANDERSON, Petroleum Geo-Services
In recent towed EM research over Statoil’s Troll complex, the data obtained corresponded well with previous seismic and stationary EM results, confirming the concept’s viability as an exploration method.
 |
| View from the back deck of the vessel during a source deployment test offshore Norway prior to the towed EM survey. The locations of the two source electrodes (towed 10 m below the surface) are indicated by the floats, which are loaded with GPS equipment to accurately position the source during the survey. |
|
During the past decade, controlled-source electromagnetic (CSEM) methods have been increasingly applied to hydrocarbon exploration. In almost every application, electrodes and coils mounted in stationary receiver nodes on the seafloor are used to measure the electromagnetic field induced by a low-frequency bipole source towed close to the seafloor. The measured field contains information about sub-seafloor resistivity, such that the structure and location of resistive bodies can be estimated. This technology is used to reveal hydrocarbon-charged reservoirs, which often exhibit increased resistivity compared with surrounding rocks.
Recent research has focused on replacing the use of stationary nodes with a system incorporating receiver electrodes into a streamer similar to those used in marine seismic acquisition. The first test system for offshore EM data acquisition was applied in a 2009 trial on the Peon shallow gas discovery in the North Sea.1 This article presents modeling and inversion results on data acquired during a further-developed prototype towed EM system over the Troll West area, also in the North Sea, in 2010.
Electric field data was acquired with a single vessel using a horizontal bipole source and sensors housed in a towed streamer. During July 2010, the data were processed and inverted to provide a resistivity profile of the sub-bottom structure. In particular, initial 3D resistivity models of the area were built using structural information from seismic data with resistivity values taken from well logs. Background models for the vertical and horizontal resistivity were estimated from 1D inversion on common-midpoint (CMP) gathers of the data along the survey lines. The resistivities in the 3D regions were then refined by iterative 3D forward modeling.
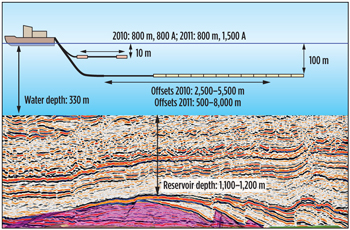
The towed EM system used in this trial consists of a horizontal bipole source 10 m below the water surface and a 6,500-m-long streamer at 100-m depth with receiver offsets ranging 2,500–5,500 m. Twelve lines of data were acquired in weather conditions up to sea state 5 at a speed of 4 knots. Frequency responses were derived for all offsets and shot points, resulting in a dense 2D grid of CMP data over the three distinct provinces. The horizontal extents of the highly resistive reservoir areas were determined directly from the data by calculating the maximum target response (TR), a normalized frequency response, at each CMP position. As a complement to the iterative 3D forward modeling, the depths of the highly resistive regions were estimated by inverting for the vertical positions of equivalent horizontal electric dipoles.
INTRODUCTION
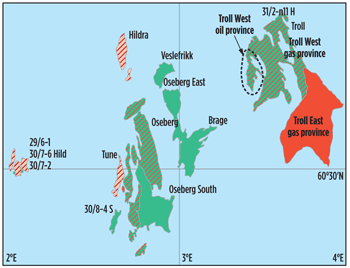
Troll field is located in the Norwegian sector of the northern North Sea, Fig. 1. Water depths range 320–350 m, and the top horizons of the reservoirs in the Troll West area are about 1,100–1,200 m below the seabed. The Troll West oil province (TWOP) has a 22–26-m oil column under a small gas column, whereas the Troll West gas province (TWGP) has a 12–14-m oil column below a massive gas column with thickness up to 200 m. Well descriptions of the Troll East gas province (TEGP) indicate a gas column as thick as 110 m. Additionally, a small area in the northern part of the field has a much thinner, 6–9-m oil column below the gas column that may be recoverable.
 |
| Fig. 1. Map of Troll field showing the Troll West oil province, Troll West gas province and Troll East gas province. |
|
The performance of CSEM is affected by the local geology. In particular, the overburden resistivity has a marked effect on the propagation of the field in the subsurface and determines the resistivity contrast of a potential target. Anisotropy (the difference between resistivity measured vertically and that measured horizontally) is similarly important. According to previously acquired data, overburden resistivity and anisotropy are fairly constant in the region: 1.5–1.8 Ω-m for horizontal and 3.0–3.3 Ω-m for vertical.
The prototype resistivity streamer system used in Troll field is towed from one vessel at a nominal speed of 4 knots, Fig. 2. The source-electrode separation in the 2010 survey was set to 800 m (maximum), and the operating current was 800 A (130 kW of total installed power). A more powerful source operating at up to 1,500 A (360 kW of total installed power) is planned for future surveys in the fourth quarter of 2011. The shape and the length of the transmitted current sequences are optimized to the specific survey configuration and geometry. The source-switching electronics and power unit is designed so that it can be set up to transmit a range of signals from a simple square wave to a pseudo-random binary sequence. During the 2010 Troll survey, a specially designed optimized repeated sequence (ORS) was used. The ORS is designed to provide a series of polarity changes, creating a signal where the energy is concentrated at the most sensitive frequencies determined by the reservoir depth.
 |
| Fig. 2. The towed EM configuration in the Troll survey. |
|
Eleven receiver offsets were used for the 2010 Troll survey, ranging 2,500–5,500 m with a separation of 300 m. In fourth-quarter 2011, the number of available offsets will be increased to 22, and the range will widen to 500–8,000 m.
ACQUISITION
The main objective of the survey was to evaluate the performance of the proto-type towed EM system with respect to reliability, noise characteristics and the ability to acquire EM data with sufficient quality to detect and characterize known targets based on their resistivity contrast. The survey was comprised of 12 lines over the Troll West area. Nine lines crossed the three main provinces (TWOP, TWGP and TEGP) in the west-east direction, one ran north-south across the TWOP, and two lines replicated earlier CSEM tests over the field.2 In total, 300 km of data were acquired, with the CMPs separated by 250 m. Each line provided about 100 CMPs. Across the west-east lines, the bathymetry of the CMPs varied only slightly, about 325–340 m. The weather during the survey was generally poor, with sea states up to 5 and wind speeds between 3 and 8 on the Beaufort scale.
The ORS generated at the source was 100 sec. long followed by a 20-sec. silent period. Thus, the total duration of the shot sequence was 120 sec. The ORS was designed to have as much energy as possible in a frequency band that optimized data sensitivity at the specific reservoir depths. The silent period of the sequence was used for noise analysis and reduction.
 |
| Fig. 3. a) The measured electric field, b) the frequency response amplitudes and c) phases for all 11 offsets at line 4, shot 60. |
|
Figure 3 shows example plots from line 4, shot 60. The resulting electric field from the ORS measured at the longest offset is shown in Fig. 3a. The recorded field data was then put through a deconvolution process to remove the input ORS, and then frequency response amplitudes (Fig. 3b) and phase (Fig. 3c) of the environment between the source and the receiver points were obtained. The frequency response function is mathematically given as:
 Eq. 1 Eq. 1
where Ẽsignal(s, ds, f), Ẽnoise(s, ds, f) and Ssignal(s, ds, f) are the Fourier transforms of the electric field due to the source, electric field noise and source sequence, respectively, as functions of shot point, offset and frequency.
MODELING AND INVERSION
The acquired data along the survey lines allowed the plotting of a dense CMP grid of frequency responses. There were 11 offsets and 13 frequencies in the reservoir-sensitive band of 0.1–1.0 Hz at each CMP. The high-data fold was used in algorithms for noise reduction, and also improved the resolution of images in the highly resistive reservoir regions. This result implied that the horizontal extent and resistive strength of the structure underneath the towed EM system could be obtained directly from the frequency response data without the need for inversion.
An efficient attribute derived from the frequency responses to image the high resistive parts is the target response (TR), which can be defined as:
 Eq. 2 Eq. 2
The target response is derived from the frequency response amplitude after it has been normalized with the amplitude of the average of the frequency responses over N CMPs.
The maximum TR for all CMPs on the east-west lines was plotted on the top horizons of the Troll West provinces, with the normalizing CMPs chosen outside the reservoirs for each line, Fig. 4a. The very-high-amplitude anomalies can be seen to tie well with the TWGP and Troll East where the lines have intersected them. This was expected, as these are large gas reservoirs with a substantial resistivity contrast. The TWOP is much thinner and has lower resistivity, and therefore provides a considerably smaller EM response. However, an increase in amplitude is still apparent, corresponding with the expected location.
 |
| Fig. 4. a) The maximum target response of the frequency response data for the east-west lines. b) Transverse resistance obtained from the same data set by 1D collated Occam’s inversion. c) A close-up of the transverse resistance over the TWOP using a compressed color scale. |
|
The next step in the data analysis was to perform 1D inversion at each of the CMPs. In this case, a 1D Occam's inversion was applied.3 The method seeks to minimize the model gradient with depth, providing the smoothest or simplest model that fits the data. The inversion is performed on multiple frequencies for a source-receiver pair, yielding a single 1D model. The models are then collated over the 2D CMP grid and integrated over depth to obtain a map of transverse resistance. In the Troll field Occam’s inversion, it is clearly seen that the high-transverse-resistance values overlap well in lateral position with the reservoirs, Fig. 4b. The highly resistive TWGP and TEGP are sharply delineated with values agreeing well with those calculated in a previous CSEM survey of the area.4 The TWOP is weaker but is also clearly seen in a close-up plot, Fig. 4c. The highest transverse resistance value in the TWOP, 2,000 Ω-m², also coincides with the reported values from the previous survey.4 These consistent values indicate that the data obtained using the towed EM system is of high quality. In particular, the absolute number of errors in the frequency responses from the measured data, including many sources of noise, is sufficiently low for imaging and mapping the TWOP.
A further consistency check of the towed EM data was to estimate the reservoir depths from the frequency responses using a fast simplified 3D inversion algorithm. This algorithm was based on the ability to approximate the integral representation for the anomalous electric field as the electric field from a dipole at the center of the sensitive part of the anomaly for each CMP. The depth down to the highly resistive anomaly at every CMP was then determined by inverting for the vertical position of the equivalent horizontal electric dipoles. The strengths of the dipoles, which can be shown to be proportional to the transverse resistance, were estimated at the same time in the same inversion. The uniqueness of the inversion was ensured by referencing frequency response data from neighboring CMPs as well as from the actual CMP in consideration.
As a first step to the dipole inversion procedure, a background resistivity model had to be determined. Naturally, it was calculated somewhere outside the highly resistive regions and then used at the anomalous regions. This is a good approximation as long as the seawater, bathymetry and overburden properties are fairly constant along the lines. If this assumption does not hold, a background model can be determined at the same time as the dipole depths and strengths.
At this point, the method was applied to the frequency responses at the CMPs constituting the east-west survey lines. A two-layer 1D background model was estimated for each of the lines outside the highly resistive regions. A gradient-based interior point algorithm was used to minimize an objective function with respect to the horizontal and vertical resistivities below the seabed. The seawater resistivity was determined from conductivity, temperature and depth measurements, and the seawater bathymetry was determined from echo sounder measurements.
Once the background models were determined, the dipole depth and strength inversions were performed with the same interior point minimization algorithm. The resulting depths were found to correspond well with the known structure from seismic data. At the TWGP, the predicted depths were within ±50 m of the correct midpoint depths below each CMP. The results at the TWOP and TEGP were also satisfactory. Thus, it was concluded that the data was consistent and provided the expected results.
Finally, a comparison between frequency responses from measured data and forward-modeled data was performed. A 3D resistivity grid model of the reservoirs was used in the forward modeling. The structure of the model was built from seismic horizon data and populated with initial resistivity values from well logs. The 3D resistivity model was then manually refined by iterative forward modeling and comparison with the measured data. This was repeated until the difference between the measured and modeled data was less than the uncertainty level of the measured data. Again, the resistivity values tie in well with those obtained in the previous CSEM survey.4
CONCLUSIONS
The analysis of the acquired data from the 2010 towed EM survey in the Troll West provinces has shown encouraging results in terms of detection and resistivity characterization of the gas and oil reservoirs, including horizontal and vertical resistivity determination of the overburden. The data was of high quality and acquired with sufficiently high signal-to-noise ratio for accurate modeling and 1D inversion with respect to the resistivity, even though the data was acquired in poor weather with sea states up to 5.
The TWGP and TEGP are clearly imaged in the data. The TWOP, which is considerably smaller in response, was also recovered well from the data and clearly imaged in the inversion. The recovered values of resistivity and transverse resistance all match well with published values. These findings demonstrate that towed EM is capable of recording data in rough seas suitable for the detection of resistivity variation due to structures such as those found in the Troll complex. 
ACKNOWLEDGMENTS
The authors thank Petroleum Geo-Services (PGS) for permission to present this work, and Statoil for permission to carry out the survey over Troll field and for its assistance with the project.
LITERATURE CITED
1 Anderson, C. and J. Mattsson, “An integrated approach to marine electromagnetic surveying using a towed streamer and source,” First Break, May 2010.
2 Amundsen, H. E. F., Johansen, S. and T. Røsten, “A sea bed logging (SBL) calibration survey over the Troll gas field,” presented at the EAGE Conference and Exhibition, Paris, June 6–10, 2004.
3 Constable. S. C., Parker, K. L. and C. G. Constable, “Occam’s inversion: A practical algorithm for generating smooth models from EM sounding data,” Geophysics, 52, No. 3, March 1987, pp. 289–300.
4 Jurgen, J. Z., Frenkel, A. M., Ostvvedt-Ghazi A.-M., de Lugao, P. and D. Ridyard, “Marine CSEM methods for 3D hydrocarbon field mapping and monitoring,” presented at the International Congress of the Brazilian Geophysical Society, Aug. 24–28, 2009.
| THE AUTHORS |
|
| JOHAN MATTSSON is a Managing Director at PGS, where he heads the system-to-signal processing project for towed EM. He earned a PhD in engineering mechanics in 1996 from Chalmers University of Technology in Gothenburg, Sweden. Dr. Mattsson has worked primarily with forward and inverse wave propagation modeling, as well as analysis of experimental data. |
|
| JONATHAN LINFOOT is Section Manager for the PGS EM Geophysics group, with primary work in modeling, inversion and interpretation of EM data and EM survey design. He earned an MSc degree at Leeds University in the UK and went to work for the startup company MTEM Ltd. He joined PGS when it purchased MTEM in 2007. |
|
| DAVID PRICE is a geophysicist with PGS, with three years’ experience within the company’s EM Geoscience group. Prior to that, he earned a PhD in geophysics at the University of Edinburgh in the UK. |
|
| JOSTEIN LIMA is the Department Manager of Software Systems for PGS, having joined the company in 1997. Previous positions include Research Geophysicist, Senior Research Geophysicist and Section Manager of High-End Visualization. Mr. Lima holds an MS degree in geophysics from the University of Oslo. |
|
| FOLKE ENGELMARK is a Geoscience Advisor for PGS in Singapore. He has been working within the oil and gas industry since 1980 and he holds an MS degree in geophysics from the Colorado School of Mines. |
|
| CHRIS ANDERSON is a Vice President within the commercialization group of PGS. He earned a BSc degree in applied physics at the City of London Polytechnic in 1989, and has since worked in various oilfield service companies, gaining expertise in seismic and EM data processing and quality metrics. |
|
|


 Eq. 2
Eq. 2

